Wednesday, August 30, 2023

Chiropractor Employment in the Rocky Mountain Region

As of May 2022, there were just over 37,700 chiropractors employed in the U.S. according to data recently published by the U.S. Bureau of Labor Statistics (BLS).  The five-state Rocky Mountain region accounted for 1,850 of those chiropractor jobs.  According to BLS data, the annual mean wage for chiropractors in all five Rocky Mountain states was below the national average.  That said, BLS data indicated that the median annual wage, which divides the top and bottom half of wage earners, for chiropractors topped the national average in two states in the region, Colorado and Idaho.  A closer examination of BLS data from May 2022 yields the following details about chiropractor employment in the Rocky Mountain region:

Chiropractor Employment in the Rocky Mountain Region

Chiropractor Employment in the Rocky Mountain Region

State # Employed Mean Annual Wage Median Annual Wage
CO 890 $82,610 $90,390
ID 200 $77,930 $80,940
MT 270 $65,500 $61,500
UT 350 $79,850 $63,570
WY 140 $64,010 $45,820
U.S. 37,740 $83,720 $75,380

Source: U.S. Bureau of Labor Statistics OES. Data extracted on August 26, 2023

Monday, August 28, 2023

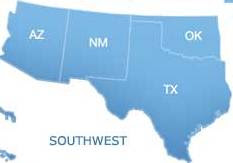
Health Services Management Pay in the Southwestern U.S.

The most current occupational employment data from the U.S. Bureau of Labor Statistics (BLS) put the number of health service management jobs in the U.S. at over 476,700 as of May 2022.  In May 2022, just over 64,000 were employed as health services managers in the four-state Southwestern U.S.  BLS data shows the region to be, on the whole, a subpar one for health services management pay.  No state in the region had a health services manager annual mean wage level that beat the national average.  Moreover, only in New Mexico did the median annual wage, which is the mid-point on the wage scale between the upper and lower half of wage earners, for health services managers top the national average.  From May 2022 BLS data, health services management pay in the Southwestern U.S. looked as follows:

Health Services Management Pay in the Southwestern U.S.

Health Services Management Pay in the Southwestern U.S.

State # Employed Median Annual Wage Mean Annual Wage
AZ 9,220 $102,940 $121,000
NM 2,350 $108,050 $126,690
OK 6,090 $95,580 $108,170
TX 46,460 $102,940 $118,700
U.S. 476,750 $104,830 $127,980

Source: U.S. Bureau of Labor Statistics OES. Data extracted on August 26, 2023

Saturday, August 26, 2023

Physician Assistant Pay in the Far West U.S.

Data released earlier this year by the U.S. Bureau of Labor Statistics (BLS) put the number of physician assistants (PAs) employed in the U.S. at nearly 141,000 as of May 2022.  Over 22,000 of those employed as PAs lived in the Far West U.S. according to BLS data.  The six-state Far West region is ranked as one of the best regions of the country for physician assistant pay.  The annual mean wage for PAs was above the national average in every state in the region except Hawaii.  Moreover, the median annual wage, which is the mid-point on the wage scale between the top and bottom half of wage earners, was better than the national average in every Far Western state, except Hawaii.  A closer look at BLS data from May 2022 reveals the following about physician assistant pay in the Far West U.S.:

Physician Assistant Pay in the Far West U.S.

Physician Assistant Pay in the Far West U.S.

State # Employed Mean Annual Wage Median Annual Wage
AK 430 $144,460 $136,400
CA 15,540 $144,520 $142,520
HI 270 $106,960 $121,740
NV 1,260 $141,360 $142,240
OR 1,580 $136,600 $132,660
WA 3,040 $145,390 $139,030
U.S. 140,910 $125,270 $126,010

Source: U.S. Bureau of Labor Statistics OES. Data extracted on August 26, 2023

Thursday, August 24, 2023

Chiropractor Pay in the Great Plains Region

According to May 2022 data made public earlier this year by the U.S. Bureau of Labor Statistics (BLS),  there were over 37,700 chiropractors working in the United States.  As of that time, the seven-state Great Plains region of the country was home to over 4,400 employed chiropractors.  For chiropractors, pay levels in the region were mostly below average relative to the nation as a whole.  The BLS reported average pay data for only five states in the region, and of that group, only one state, Minnesota, registered a mean annual wage for the profession that was better than the national average.  And none of the five Great Plains states included in BLS reporting had an above-average median annual wage, which is the point that divides the top and lower half of earners on the wage scale.  From a closer examination of May 2022 BLS data, the following details were revealed about chiropractor pay in the Great Plains region of the U.S.:

Chiropractor Pay in the Great Plains Region

Chiropractor Pay in the Great Plains Region

State # Employed Mean Annual Wage Median Annual Wage
IA 870 $62,970 $60,620
KS 590 ------- -------
MN 1,330 $85,180 $75,230
MO 770 $80,290 $60,090
NE 440 $79,290 $69,070
ND 210 ------- -------
SD 240 $80,180 $71,430
U.S. 37,740 $83,720 $75,380

Source: U.S. Bureau of Labor Statistics OES. Data extracted on August 20, 2023

Wednesday, August 23, 2023

Health Services Management Employment in the Southeast

Health services managers, ranging from front-line supervisors to chief executives, play a key role in maximizing the operational effectiveness of a wide variety of healthcare businesses, including hospitals, physicians' offices, outpatient care centers, skilled nursing facilities, and home health care service providers. There were over 476,000 health service management jobs in the U.S. as of May 2022 according to recent data published by the U.S. Bureau of Labor Statistics (BLS).  As of May 2022, there were 118,000 health services management jobs in the twelve-state Southeast region.  On a relative basis health service management jobs in the Southeast paid less than in other regions of the country.  The profession's median annual wage, which is the mid-point on the wage scale between the upper and lower half of wage earners, topped the national average of $104,830 in only two Southeast states, Georgia and Virginia.  Moreover, about 45% of the health service managers in the Southeast lived in states where the profession's median annual wage was more than 5% below the national average.  A deeper look into May 2022 BLS data details the following about health services management employment in the Southeast:

Health Services Management Employment in the Southeast

Health Services Management Employment in the Southeast

State # Employed Median Annual Wage Mean Annual Wage
AL 8,480 $82,160 $94,200
AR 6,360 $80,330 $94,840
FL 32,730 $101,700 $119,520
GA 8,300 $113,060 $129,900
KY 8,990 $94,180 $107,990
LA 6,070 $98,760 $111,040
MS 4,610 $80,950 $92,890
NC 12,230 $102,910 $125,220
SC 7,320 $98,690 $114,970
TN 11,810 $98,860 $111,840
VA 9,120 $107,020 $123,670
WV 1,980 $101,770 $115,060
U.S. 476,750 $104,830 $127,980

Source: U.S. Bureau of Labor Statistics OES. Data extracted on August 20, 2023

Monday, August 21, 2023

Physician Assistant Pay in the Rocky Mountain Region

The U.S. Bureau of Labor Statistics (BLS) most current occupational employment data put physician assistant (PA) employment at just over 140,900 nationally as of May 2022.  Just over 6,600 of those physician assistant jobs were in the five-state Rocky Mountain region.  BLS data painted a generally weak picture of physician assistant pay levels in the region.  Only about 5% of the region's physician assistants lived in Wyoming, the only state in the region where the mean annual wage for the profession was above the national average.  A closer examination of BLS data from May 2022 reveals the following details about physician assistant pay in the Rocky Mountain region:

Physician Assistant Pay in the Rocky Mountain Region

Physician Assistant Pay in the Rocky Mountain Region


State # Employed Mean Annual Wage Median Annual Wage
CO 2,770 $122,330 $122,640
ID 1,050 $120,220 $121,590
MT 700 $122,310 $128,120
UT 1,750 $124,860 $123,320
WY 340 $131,340 $131,720
U.S. 140,910 $125,270 $126,010

Source: U.S. Bureau of Labor Statistics OES. Data extracted on August 16, 2023

Sunday, August 20, 2023

Chiropractor Pay in the Mid-East Region of the U.S.

According to data released earlier this year by the U.S. Bureau of Labor Statistics (BLS), as of May 2022, there were more than 37,700 chiropractors working in the United States.  About 4,900 of those working chiropractors lived in the five-state Mid-East region of the country.  For chiropractors, there was much disparity in pay levels in the region at the state level.  About two-thirds of the region's chiropractors lived in Maryland, New Jersey, and New York, where the median annual wage for chiropractors was at least 14% above the national average.  In contrast, the chiropractor median annual wage level in Delaware and Pennsylvania fell short of the national average by about 15% and 20%, respectively.  A closer look at BLS data from May 2022 details the following about chiropractor pay in the Mid-East region of the U.S.:

Chiropractor Pay in the Mid-East Region of the U.S.

Chiropractor Pay in the Mid-East Region of the U.S.

State # Employed Mean Annual Wage Median Annual Wage
DE 130 $87,760 $64,270
MD 700 $86,730 $105,560
NJ 650 $113,120 $86,130
NY 1,890 $97,720 $93,260
PA 1,550 $67,370 $59,960
U.S. 37,740 $83,720 $75,380

Source: U.S. Bureau of Labor Statistics OES. Data extracted on August 14, 2023

Friday, August 18, 2023

Health Services Management Pay in the Far Western U.S.

The U.S. had more than 476,000 health service management jobs as of May 2022 according to the latest occupational employment data available from the U.S. Bureau of Labor Statistics (BLS).  As of May 2022, over 71,000 health services managers were working in the six-state Far West region of the country.  BLS data revealed the region to be one of the best in the nation for health services management pay.  The median annual wage level, which is the mid-point on the wage scale that divides the upper and lower half of wage earners, exceeded the national average for health services managers by at least 11% in every state in the Far West, except for Nevada.  A deeper look at May 2022 BLS data revealed the following details about health services management pay in the Far Western U.S.:

Health Services Management Pay in the Far Western U.S.

Health Services Management Pay in the Far Western U.S.

State # Employed Median Annual Wage Mean Annual Wage
AK 1,210 $116,920 $135,330
CA 52,350 $131,880 $145,090
HI 1,880 $117,330 $125,690
NV 3,860 $101,880 $111,040
OR 5,390 $124,730 $140,460
WA 6,480 $129,870 $144,580
U.S. 476,750 $104,830 $127,980

Source: U.S. Bureau of Labor Statistics OES. Data extracted on August 14, 2023

Thursday, August 17, 2023

Physician Assistant Pay in the Southwestern U.S.

The latest U.S. Bureau of Labor Statistics (BLS) data on physician assistant (PA) employment put the number of PAs employed at just over 140,900 as of May 2022.  The four-state Southwestern U.S. was home to about 14,300 of those physician assistants according to the BLS.  BLS data revealed PA pay levels in the region to be roughly on par with physician assistant pay levels in the U.S. as a whole, at least in terms of median annual wages.  In all four Southwestern states the median annual wage, which is the wage level that is the mid-point between the upper and lower half of wage earners, was slightly better than the national average.  A further examination of BLS data from May 2022 revealed the following about physician assistant pay in the Southwestern U.S.:

Physician Assistant Pay in the Southwestern U.S.

Physician Assistant Pay in the Southwestern U.S.


State # Employed Mean Annual Wage Median Annual Wage
AZ 3,280 $122,420 $126,240
NM 690 $133,630 $127,880
OK 1,380 $116,710 $126,050
TX 8,930 $132,980 $127,330
U.S. 140,910 $125,270 $126,010

Source: U.S. Bureau of Labor Statistics OES. Data extracted on August 13, 2023

Tuesday, August 15, 2023

Chiropractor Pay in the Great Lakes Region

According to data published earlier this year by the U.S. Bureau of Labor Statistics (BLS), as of May 2022, there were more than 37,700 chiropractors employed in the United States.  Nearly 6,300 of those employed as chiropractors lived in the five-state Great Lakes region.  For chiropractors, pay levels in the region were mostly below average compared to the U.S. as a whole.  The median annual wage, which is the wage level that divides the top and bottom half of wage earners, for chiropractors exceeded the national average in Indiana.  However, in the other four states, which collectively accounted for 86% of the regions' employed chiropractors, the median annual wage fell below the national average. BLS data from May 2022 reveals the following details about chiropractor pay in the Great Lakes region:

Chiropractor Pay in the Great Lakes Region

Chiropractor Pay in the Great Lakes Region

State # Employed Mean Annual Wage Median Annual Wage
IL 1,700 $73,580 $61,200
IN 850 $99,880 $84,710
MI 1,550 $81,880 $69,660
OH 910 $86,600 $65,180
WI 1,250 $80,790 $74,130
U.S. 37,740 $83,720 $75,380

(*) annual mean wage ranking among the 50 states

Source: U.S. Bureau of Labor Statistics OES. Data extracted on August 13, 2023

Monday, August 14, 2023

Health Services Management Pay in the Great Plains Region

From chief executives to front-line supervisors, health services managers are an important element in the operational effectiveness of a wide variety of healthcare businesses. Health services managers play key operating roles in hospitals, skilled nursing facilities, physicians' offices, ambulatory care centers, home healthcare providers, and many other types of healthcare businesses. Data released earlier this year by the U.S. Bureau of Labor Statistics (BLS) put the number of health service management jobs in the United States at about 476,750 as of May 2022.  Just over 32,800 health services managers were employed in the seven-state Great Plains region.  For the most part, the region was a weak one for health services management pay.  About 95% of the region's health services managers were employed in states where the median annual wage level for health service management professionals was below the national average.  A closer review of May 2022 BLS data shows the following about health services management pay in the Great Plains region:

Health Services Management Pay in the Great Plains Region

Health Services Management Pay in the Great Plains Region

State # Employed Median Annual Wage Mean Annual Wage
IA 5,900 $95,380 $107,750
KS 4,690 $96,280 $105,660
MN 9,630 $102,560 $117,480
MO 7,180 $100,100 $111,970
NE 3,860 $99,220 $113,110
ND 590 $106,210 $129,920
SD 960 $104,940 $118,840
U.S. 476,750 $104,830 $127,980

Source: U.S. Bureau of Labor Statistics OES. Data extracted on August 13, 2023

Saturday, August 12, 2023

Physician Assistant Pay in the Mid-East U.S. Region

Recently published May 2022 data from the U.S. Bureau of Labor Statistics (BLS) put physician assistant (PA) employment at just over 140,900 nationally.  Nearly 30,800 of those PA jobs were in the Mid-East region of the country, which encompasses the District of Columbia and five states.  BLS data revealed a mixed tale about pay levels for physician assistants in the region as only two Mid-East U.S. states, New Jersey and New York, recorded mean annual wage levels for physician assistants that beat the national average.  A closer examination of BLS data from May 2022 revealed the following about physician assistant pay in the Mid-East U.S. region:

Physician Assistant Pay in the Mid-East U.S. Region

Physician Assistant Pay in the Mid-East U.S. Region

State # Employed Mean Annual Wage Median Annual Wage
DC 580 $126,230 $127,140
DE 640 $124,140 $126,320
MD 3,720 $113,340 $118,390
NJ 4,660 $131,070 $128,960
NY 14,790 $135,620 $134,360
PA 6,400 $110,140 $109,100
U.S. 140,910 $125,270 $126,010

Source: U.S. Bureau of Labor Statistics OES. Data extracted on August 12, 2023

Thursday, August 10, 2023

Chiropractor Pay in the New England Region

According to data recently published by the U.S. Bureau of Labor Statistics (BLS), as of May 2022, there were just over 37,700 chiropractors employed in the United States.  More than 1,400 of those employed as chiropractors lived in the six-state New England region.  For chiropractors, pay levels in the region were mixed.  Connecticut, Massachusetts, and New Hampshire, home to about 69% of the region's chiropractors, were the only states in the region where annual mean and median wage levels for chiropractors topped the national average.  From BLS statistical data from May 2022, here is a summary look at chiropractor pay in the New England region:

Chiropractor Pay in the New England Region

Chiropractor Pay in the New England Region

State # Employed Mean Annual Wage Median Annual Wage
CT 200 $97,620 $99,610
MA 660 $107,900 $102,840
ME 230 $72,270 $60,880
NH 120 $87,580 $78,180
RI 110 n/a n/a
VT 110 $74,600 $58,360
U.S. 37,740 $83,720 $75,380

Source: U.S. Bureau of Labor Statistics OES. Data extracted on August 10, 2023

Sunday, August 6, 2023

Health Services Management Pay in the Rocky Mountain Region

Health services managers, ranging from chief executives to front-line supervisors, are integral to maximizing the operational effectiveness of a wide variety of healthcare businesses, including hospitals, outpatient care centers, skilled nursing facilities, physicians' offices, and home healthcare providers. There were about 477,000 health service management jobs in the U.S. as of May 2022 according to data released by the U.S. Bureau of Labor Statistics (BLS).  About 14,000 of those employed as health services managers lived in the five-state Rocky Mountain region.  Except in Colorado, both the mean and the median annual wage for health services managers in every state in the region was below the national average for the profession.  A closer examination of May 2022 BLS data shows us the following about health services management pay in the Rocky Mountain region:

Health Services Management Pay in the Rocky Mountain Region

Health Services Management Pay in the Rocky Mountain Region


State # Employed Median Annual Wage Mean Annual Wage
CO 6,930 $120,820 $135,890
ID n/a $102,560 $123,380
MT 2,110 $96,700 $102,500
UT 4,040 $99,660 $119,120
WY 890 $100,230 $104,640
U.S. 476,750 $104,830 $127,980

Source: U.S. Bureau of Labor Statistics OES. Data extracted on August 6, 2023

Tuesday, August 1, 2023

New Survey Recognizes Twenty-Seven Southeastern U.S. Children's Hospitals

In the latest U.S. News & World Report rankings of American hospitals, just 89 hospitals surveyed earned national distinction in at least one of the ten pediatric specialties examined in the survey.  No pediatric hospitals in the Southeast ranked among the top 10 pediatric hospitals in the nation, but 27 children's hospitals in the region earned a top 50 national ranking in at least one of the ten specialties analyzed.  Here's a summary overview of the twenty-seven Southeastern U.S. children's hospitals that earned recognition among the best pediatric hospitals in the United States in the most recent USNWR survey:

New Survey Recognizes Twenty-Seven Southeastern U.S. Children's Hospitals

New Survey Recognizes
Twenty-Seven Southeastern U.S. Children's Hospitals

Children's Healthcare of Atlanta
Location: Atlanta
Nationally Ranked Pediatric Specialties: 10 of 10 
Pediatric Specialties Ranked in the Top 50 Nationally: 
#8   Cancer
#12 Cardiology & Heart Surgery
#38 Diabetes & Endocrinology
#9   Gastroenterology & GI Surgery
#31 Neonatology
#11 Nephrology
#19 Neurology & Neurosurgery
#10 Orthopedics
#16 Pulmonology & Lung Surgery
#10 Urology
(See ranking details)

Duke Children's Hospital
Location: Durham, NC
Nationally Ranked Pediatric Specialties: 10 of 10
Pediatric Specialties Ranked in the Top 50 Nationally:
#26 Cancer
#2   Cardiology & Heart Surgery
#32 Diabetes & Endocrinology
#20 Gastroenterology & GI Surgery
#14 Neonatology
#31 Nephrology
#45 Neurology & Neurosurgery
#23 Orthopedics
#23 Pulmonology & Lung Surgery
#19 Urology

Carell Children's Hospital at Vanderbilt
Location: Nashville, TN
Nationally Ranked Pediatric Specialties: 10 of 10 
Pediatric Specialties Ranked in the Top 50 Nationally:
#42 Cancer
#30 Cardiology & Heart Surgery
#32 Diabetes & Endocrinology
#30 Gastroenterology & GI Surgery
#22 Neonatology
#44 Nephrology
#25 Neurology & Neurosurgery
#22 Orthopedics
#21 Pulmonology & Lung Surgery
#11 Urology

North Carolina Children's Hospital at UNC
Location: Chapel Hill, NC
Nationally Ranked Pediatric Specialties: 9 of 10 
Pediatric Specialties Ranked in the Top 50 Nationally:
#36 Cancer
#24 Diabetes & Endocrinology
#38 Gastroenterology & GI Surgery
#27 Neonatology
#45 Nephrology
#20 Neurology & Neurosurgery
#21 Orthopedics
#15 Pulmonology & Lung Surgery
#23 Urology

UVA Children's Hospital
Location: Charlottesville, VA
Nationally Ranked Pediatric Specialties: 9 of 10 
Pediatric Specialties Ranked in the Top 50 Nationally:
#36 Cardiology & Heart Surgery
#34 Diabetes & Endocrinology
#29 Gastroenterology & GI Surgery
#23 Neonatology
#32 Nephrology
#40 Neurology & Neurosurgery
#34 Orthopedics
#38 Pulmonology & Lung Surgery
#43 Urology

Children's Hospital of Alabama
Location: Birmingham, AL
Nationally Ranked Pediatric Specialties: 8 of 10
Pediatric Specialties Ranked in the Top 50 Nationally:
#34 Cancer
#15 Cardiology & Heart Surgery
#47 Diabetes & Endocrinology
#44 Gastroenterology & GI Surgery
#20 Nephrology
#34 Neurology & Neurosurgery
#34 Pulmonology & Lung Surgery
#39 Urology

Levine Children's Hospital
Location: Charlotte, NC
Nationally Ranked Pediatric  Specialties: 8 of 10 
Pediatric Specialties Ranked in the Top 50 Nationally:
#31 Cancer
#8   Cardiology & Heart Surgery
#22 Gastroenterology & GI Surgery
#43 Neonatology
#27 Nephrology
#19 Orthopedics
#27 Pulmonology & Lung Surgery
#32 Urology

Children's Hospital of Richmond at VCU
Location: Richmond, VA
Nationally Ranked Pediatric  Specialties: 8 of 10 
Pediatric Specialties Ranked in the Top 50 Nationally:
#37 Cancer
#41 Diabetes & Endocrinology
#36 Gastroenterology & GI Surgery
#49 Neonatology
#26 Nephrology
#33 Neurology & Neurosurgery
#26 Pulmonology & Lung Surgery
#33 Urology

Johns Hopkins All Children's Hospital
Location: St. Petersburg, FL
Nationally Ranked Pediatric Specialties: 7 of 10 
Pediatric Specialties Ranked in the Top 50 Nationally:
#31 Cancer
#26 Diabetes & Endocrinology
#36 Neonatology
#39 Nephrology
#26 Neurology & Neurosurgery
#47 Orthopedics
#41 Pulmonology & Lung Surgery

Arkansas Children’s Hospital
Location: Little Rock, AR
Nationally Ranked Pediatric Specialties: 7 of 10 
Pediatric Specialties Ranked in the Top 50 Nationally:
#40 Cancer
#45 Cardiology & Heart Surgery
#44 Diabetes & Endocrinology
#34 Nephrology
#45 Orthopedics
#31 Pulmonology & Lung Surgery
#39 Urology

Nationally Ranked Pediatric Specialties: 6 of 10 
Pediatric Specialties Ranked in the Top 50 Nationally:
#26 Cancer
#4   Cardiology & Heart Surgery
#50 Gastroenterology & GI Surgery
#44 Neonatology
#48 Nephrology
#36 Orthopedics

Norton Children’s Hospital
Location: Louisville, KY
Nationally Ranked Pediatric Specialties: 6 of 10 
Pediatric Specialties Ranked in the Top 50 Nationally:
#41 Cardiology & Heart Surgery
#23 Diabetes & Endocrinology
#28 Neurology & Neurosurgery
#44 Orthopedics
#36 Pulmonology & Lung Surgery
#21 Urology

Nicklaus Children's Hospital
Location: Miami, FL
Nationally Ranked Pediatric Specialties: 5 of 10 
Pediatric Specialties Ranked in the Top 50 Nationally:
#37 Cardiology & Heart Surgery
#45 Neonatology
#22 Neurology & Neurosurgery
#31 Orthopedics
#48 Pulmonology & Lung Surgery

Le Bonheur Children's Hospital
Location: Memphis, TN
Nationally Ranked Pediatric Specialties: 5 of 10 
Pediatric Specialties Ranked in the Top 50 Nationally:
#28 Cardiology & Heart Surgery
#37 Gastroenterology & GI Surgery
#29 Neurology & Neurosurgery
#42 Pulmonology & Lung Surgery
#43 Urology

Location: Gainesville, FL
Nationally Ranked Pediatric Specialties: 4 of 10 
Pediatric Specialties Ranked in the Top 50 Nationally:
#26 Cardiology & Heart Surgery
#10 Diabetes & Endocrinology
#35 Neonatology
#24 Pulmonology & Lung Surgery

Arnold Palmer's Children's Hospital
Location:  Orlando, FL
Nationally Ranked Pediatric Specialties: 4 of 10 
Pediatric Specialties Ranked in the Top 50 Nationally:
#34 Diabetes & Endocrinology
#49 Neonatology
#45 Orthopedics
#50 Pulmonology & Lung Surgery

Kentucky Children's Hospital
Location:  Lexington, KY
Nationally Ranked Pediatric Specialties: 3 of 10 
Pediatric Specialties Ranked in the Top 50 Nationally:
#7   Cardiology & Heart Surgery
#42 Orthopedics
#42 Urology

West Virginia University Children's Hospital
Location:  Morgantown, WV
Nationally Ranked Pediatric Specialties: 2 of 10 
Pediatric Specialties Ranked in the Top 50 Nationally:
#42 Neurology & Neurosurgery
#35 Urology

Ochsner Hospital for Children
Location:  New Orleans, LA
Nationally Ranked Pediatric Specialties: 2 of 10 
Pediatric Specialties Ranked in the Top 50 Nationally:
#34 Cardiology & Heart Surgery
#48 Orthopedics

Nemours Children's Hospital-Florida
Location:  Orlando, FL
Nationally Ranked Pediatric Specialties: 2 of 10 
Pediatric Specialties Ranked in the Top 50 Nationally:
#49 Diabetes & Endocrinology
#50 Orthopedics

Wolfson Children's Hospital
Location:  Jacksonville, FL
Nationally Ranked Pediatric Specialties: 2 of 10 
Pediatric Specialties Ranked in the Top 50 Nationally:
#30 Diabetes & Endocrinology
#37 Neurology & Neurosurgery

Inova L.J. Murphy Children's Hospital
Location:  Falls Church, VA
Nationally Ranked Pediatric Specialties: 1 of 10 
Pediatric Specialties Ranked in the Top 50 Nationally:
#46  Neonatology

St. Jude Children's Research Hospital
Location:  Memphis, TN
Nationally Ranked Pediatric Specialties: 1 of 10 
Pediatric Specialties Ranked in the Top 50 Nationally:
#5  Cancer

Advent Health For Children
Location:  Orlando, FL
Nationally Ranked Pediatric Specialties: 1 of 10 
Pediatric Specialties Ranked in the Top 50 Nationally:
#32 Neonatology

Shriner's Hospital for Children Medical Center
Location:  Lexington, KY
Nationally Ranked Pediatric Specialties: 1 of 10 
Pediatric Specialties Ranked in the Top 50 Nationally:
#42 Orthopedics

Holtz Children's Hospital
Location:  Miami, FL
Nationally Ranked Pediatric Specialties: 1 of 10 
Pediatric Specialties Ranked in the Top 50 Nationally:
#45 Diabetes & Endocrinology

Joe DiMaggio Children's Hospital
Location:  Hollywood, FL
Nationally Ranked Pediatric Specialties: 1 of 10 
Pediatric Specialties Ranked in the Top 50 Nationally:
#49 Orthopedics

For more information about the metrics used to rate pediatric hospitals in the 23-24 USNWR survey, or to find the rating of other children's hospitals in the Southeastern U.S. or elsewhere in the nation, visit USNWR Best Children's Hospitals.