Friday, January 29, 2021

CHIP and Medicaid Child Enrollment in the Far West

Public funding plays an important role in children's health insurance coverage in the United States. Data from the National Health Interview Survey (2019) indicates that around 41% of American children under the age of 18 have health insurance coverage that depends on public funding. While health benefit programs for government personnel, including the military, account for some of the child enrollment in publicly funded health insurance plans, it is Medicaid and the Children's Health Insurance Program (CHIP) that are the two chief drivers of publicly funded health insurance coverage for children in the United States. Federal reports indicate that, as of September 2020, there were 37.4 million individuals who were either enrolled in CHIP or who were children enrolled in the Medicaid program. Medicaid, the joint state-federal health insurance program for eligible individuals with limited income and resources, provides insurance coverage for more than 30 million American children. Another 6.7 million individuals are enrolled in CHIP plans. CHIP is a related joint state-federal effort to make health insurance coverage available to children from families with low incomes, but not low enough to qualify for standard Medicaid coverage.

As of September 2020, the six-state Far West region accounted for 23.4% of the national enrollment in CHIP and 17.0% of U.S. children enrolled in the Medicaid program.  Here is a summary look at CHIP and Medicaid Child enrollment in the Far West region of the United States:
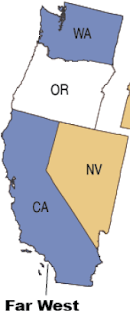
CHIP and Medicaid Child Enrollment in the Far West

State (1) CHIP (2) Medicaid Child Total
AK 13.7 85.1 98.8
CA 1,288.4 3,632.8 4,921.2
HI 25.4 124.4 149.8
NV 38.2 286.1 324.3
OR 133.8 304.1 437.9
WA 70.3 778.3 848.6
Region 1,569.8 5,210.8 6,780.6
U.S. 6,719.1 30,641.9 37,361.0

(1) CHIP enrollment, in thousands
(2) Children enrolled in Medicaid plans, in thousands (derived by deducting State reported CHIP enrollment from State Reported Total Medicaid Child and CHIP enrollment)

Source: Medicaid.gov Enrollment Reports as of September, 2020

Thursday, January 28, 2021

UCLA Health, our Trusted Link for January 2021


In 1951, the UCLA School of Medicine accepted its first students, and by 1955 its primary teaching hospital, UCLA Medical Center, opened on the campus. Today, UCLA Health is the top-ranked hospital system in California, and 4th ranked in the nation by U.S. News. The medical school is now named for David Geffen, and the campus also includes schools of nursing, dentistry, and public health. 

Major achievements:

  • In the 1960s, UCLA faculty developed the tissue-matching test that makes organ transplants practical. Since then, over 6000 liver, 8000 kidney, and thousands of other transplants been performed. 
  • The UCLA Geriatrics program, ranked 3rd in the nation by U.S. News, is famous for its Companion Care program. 
  • One of the earliest AIDS research programs has made numerous discoveries and therapy breakthroughs. 

Innovation and exploration at UCLA Health is driven by their commitment to diversity of talent and a culture of collaboration. Past successes include

Current endeavors include

UCLA Health publications are Vital Signs for the general public, U Magazine from the medical school, and Physicians Update

See how their ChatterBaby app diagnoses baby cries

Private Sector Employee-Only Health Premium Costs in New England

The annual cost for single premium (i.e. employee-only) health insurance coverage charged to private sector employers in New England is typically higher than in other regions of the United States. Only small firms, with fewer than 50 employees, in Maine find themselves looking at annual premium costs that are below the national average for similar-sized employers. Annual employee-only health insurance premium costs for small employers in the other five New England states, and larger employers throughout the region, typically run higher than national averages.  2019 data from the most recent Medical Expenditure Panel Survey, a data survey administered by the U.S. Department of Health and Human Services' Agency for Healthcare Research and Quality, reveals the following about private sector employee-only health premium costs in New England and nationally:

State (1) Smaller Firms (2) Larger Firms Overall Avg.
CT $7,607 $7,492 $7,516
ME $6,295 $7,720 $7,424
MA $8,017 $7,441 $7,540
NH $7,136 $7,284 $7,255
RI $7,483 $7,202 $7,263
VT $6,978 $7,415 $7,319
U.S. $6,920 $6,983 $6,972

(1) fewer than 50 employees
(2) 50 or more employees

Source:  Medical Expenditure Panel Survey  Table II.C.1 - Average total single premium (in dollars) per enrolled employee at private-sector establishments that offer health insurance by firm size and State: United States, 2019

Monday, January 25, 2021

CHIP and Medicaid Child Enrollment in the MidEast Region

The National Health Interview Survey (2019) estimated that about 41% of American children under the age of 18 have health insurance coverage that depends on public funding. Health benefit programs for government personnel, including the military, are a source of some of the child enrollment in health insurance plans subsidized by taxpayer dollars.  However, it is Medicaid and the Children's Health Insurance Program (CHIP) that are the two primary drivers of publicly funded health insurance coverage for children in the United States. Medicaid is the joint state-federal health insurance program for eligible individuals with limited income and resources.  Similarly, CHIP is a joint state-federal effort to make available health insurance coverage for children from families with low incomes, but not low enough to qualify for standard Medicaid coverage.  Federal reports indicate that, as of September 2020, there were 37.4 million individuals who were either enrolled in CHIP or who were children enrolled in the Medicaid program.

That same September 2020 data reveals that the five-state MidEast region accounted for 17.9% of the national enrollment in CHIP and 14.5% of U.S. children enrolled in the Medicaid program.  Here is a summary look at CHIP and Medicaid Child enrollment in the MidEast region of the United States:

CHIP and Medicaid Child Enrollment in the MidEast Region

CHIP and Medicaid Child Enrollment in the MidEast Region

State (1) CHIP (2) Medicaid Child Total
DE 11.2 99.9 111.1
DC 17.4 76.9 94.3
MD 143.0 504.7 647.7
NJ 239.8 619.9 859.7
NY 612.2 1,869.9 2,482.1
PA 177.9 1,276.7 1,454.6
Region 1,201.5 4,448.0 5,649.5
U.S. 6,719.1 30,641.9 37,361.0

(1) CHIP enrollment, in thousands
(2) Children enrolled in Medicaid plans, in thousands (derived by deducting State reported CHIP enrollment from State Reported Total Medicaid Child and CHIP enrollment)

Source: Medicaid.gov Enrollment Reports as of September, 2020

Sunday, January 24, 2021

The Mental Health Care Shortage by Region

September 2020 data from the Health Resources and Services Administration (HRSA) reveals that an estimated 119 million Americans lived in areas designated as a mental health care Health Professional Shortage Area (HPSA). A geographic area, population group, or facility, residents of mental health care HPSAs have poor access to basic mental health services because the area lacks a sufficient number of psychiatrists and/or core mental health providers. For HRSA purposes, core mental health providers include marriage & family therapists, psychiatric nurse specialists, clinical social psychologists, and clinical social workers. HRSA designation criteria is based upon the population within the HPSA relative to the number of mental health care providers that service the area. Although the population-to-provider ratio needed to qualify for designation varies by HPSA type (geographic, population or facility), all HPSAs with a mental health care shortage designation have a population-to-provider ratio that meets or exceeds certain thresholds established by federal regulations.  As of September 2020, the HRSA estimates that all mental health care shortage areas in the U.S. would need just under 6,500 more practitioners to eliminate all such shortage designations.

Here is a summary look at the mental health care shortage by region (for state-level details, follow the "region" link):

Region (1) HPSAs (2) Population (3) Shortage
Far West
1,223 17,151.6 874
Great Lakes
710 18,095.8 837
Great Plains
784 8,649.8 419
MidEast
390 7,157.7 520
New England
193 2,173.0 120
Rocky Mountain
317 7,693.1 363
Southeast
1,236 35,483.3 2,198
Southwest
814 20,819.0 979
U.S. Territories
66 2,120.7 154
U.S. 5,733 119,344.0 6,464

(1) Designated Geographic, Population Group and Facility HPSAs with a mental health care shortage
(2) Population of designated HPSAs, in thousands
(3) Mental Health Care practitioners needed to remove HPSA Designation

Source:  Designated HPSA Quarterly Summary, 9/30/20 (HRSA)

Saturday, January 23, 2021

The Dental Care Shortage by Region

As of September 2020, an estimated 60 million Americans lived in areas designated as a dental care Health Professional Shortage Area (HPSA) by the Health Resources and Services Administration (HRSA).  A geographic area, population group, or facility, residents of dental care HPSAs have poor access to basic dental health services because the area lacks a sufficient number of Dentists and dental auxiliaries (any non-dentist staff employed by the dentist to assist in the operation of the practice). HRSA designation criteria is based upon the population within the HPSA relative to the number of dental care providers that service the area. Although the population-to-provider ratio needed to qualify for designation varies by HPSA type (geographic, population or facility), all HPSAs with a dental care shortage designation have a population-to-provider ratio that meets or exceeds certain limits set by federal regulations.  As of September 2020, the HRSA estimates that all dental care shortage areas in the U.S. would need just over 10,700 more practitioners to eliminate all such shortage designations.

Here is a summary look at the dental care shortage by region (for state-level details, follow the "region" link):

Region (1) HPSAs (2) Population (3) Shortage
Far West
1,173 5,522.0 1,016
Great Lakes
811 8,369.4 1,536
Great Plains
1,003 3,787.9 707
MidEast
384 6,288.9 1,168
New England
225 1,268.1 196
Rocky Mountain
410 2,446.4 334
Southeast
1,663 24,669.8 4,529
Southwest
772 7,115.2 1,123
U.S. Territories
46 473.4 107
U.S. 6,487 59,941.1 10,716

(1) Designated Geographic, Population Group and Facility HPSAs with a dental care shortage
(2) Population of designated HPSAs, in thousands
(3) Dental Care practitioners needed to remove HPSA Designation

Source:  Designated HPSA Quarterly Summary, 9/30/20 (HRSA)

Friday, January 22, 2021

The Primary Care Shortage by Region

As of September 2020, an estimated 81 million Americans lived in more than 7,200 areas designated as a primary care Health Professional Shortage Area (HPSA) by the Health Resources and Services Administration (HRSA).  A geographic area, population group, or facility, residents of primary care HPSAs have poor access to basic health services because the area lacks a sufficient number of Doctors of Medicine (MD) or Doctors of Osteopathy (DO) who provide services as general or family practitioners, general internal medicine physicians, pediatricians, obstetricians or gynecologists. HRSA designation criteria is based upon the population within the HPSA relative to the number of primary care providers that service the area. Although the population-to-provider ratio needed to qualify for designation varies by HPSA type (geographic, population or facility), all HPSAs with a primary care shortage designation have a population-to-provider ratio that meets or exceeds certain thresholds stipulated by federal regulations.  As of September 2020, the HRSA estimates that all primary care shortage areas in the U.S. would need just under 15,000 more providers to eliminate all such shortage designations.

Here is a summary look at the primary care shortage by region (for state-level details, follow the "region" link):

Region (1) HPSAs (2) Population (3) Shortage
Far West
1,374 13,240.8 2,654
Great Lakes
878 11,229.0 1,586
Great Plains
1,063 4,159.9 908
MidEast
416 6,733.0 1,558
New England
228 1,334.5 305
Rocky Mountain
466 2,971.0 540
Southeast
1,818 27,003.5 4,748
Southwest
898 12,595.8 1,983
U.S. Territories
62 2,248.8 663
U.S. 7,203 81,516.3 14,945

(1) Designated Geographic, Population Group and Facility HPSAs with a primary care shortage
(2) Population of designated HPSAs, in thousands
(3) Primary Care practitioners needed to remove HPSA Designation

Source:  Designated HPSA Quarterly Summary, 9/30/20 (HRSA)

Tuesday, January 19, 2021

CHIP and Medicaid Child Enrollment in the Great Plains Region

According to the National Health Interview Survey (2019), about 41% of American children under the age of 18 have publicly supported health insurance coverage. While health insurance plans for government employees, including military personnel, account for some of the child enrollment in publicly supported health insurance programs, the vast majority of such coverage is provided by Medicaid and the Children's Health Insurance Program (CHIP). Medicaid and CHIP are joint state-federal health insurance programs for eligible Americans with limited income and resources.  Medicaid is aimed at low income individuals and families, while CHIP is designed specifically for children from poor families with incomes too high to qualify for standard Medicaid coverage.  Federal reports from September 2020 reveal that there were 37.4 million individuals who were either enrolled in CHIP or who were children enrolled in the Medicaid program.

September 2020 data shows us that the seven-state Great Plains region accounted for about 3.6% of American children who were enrolled in CHIP and 6.1% of U.S. children enrolled in the Medicaid program.  Here is a deeper look at the numbers for CHIP and Medicaid Child enrollment in the Great Plains region:

CHIP and Medicaid Child Enrollment in the Great Plains Region

State (1) CHIP (2) Medicaid Child Total
IA 80.2 272.8 353.0
KS 64.4 221.3 285.7
MN 1.3 558.3 559.6
MO 40.4 567.8 608.2
ND 2.5 45.5 48.0
NE 34.4 140.0 174.4
SD 16.1 67.8 83.9
Region 239.3 1,873.5 2,112.8
U.S. 6,719.1 30,641.9 37,361.0

(1) CHIP enrollment, in thousands
(2) Children enrolled in Medicaid plans, in thousands (derived by deducting State reported CHIP enrollment from State Reported Total Medicaid Child and CHIP enrollment)

Source: Medicaid.gov Enrollment Reports as of September, 2020
Friday, January 15, 2021

The Mental Health Care Shortage in the Far West

September 2020 data released by the Health Resources and Services Administration (HRSA) indicates that over 119 million Americans live in over 5,700 areas or settings designated as a mental health care Health Professional Shortage Area (HPSA). A mental health care HPSA is a geographic area, population group, or facility where access to mental health care is substandard because it lacks a sufficient number of mental health care providers. With respect to mental health care, HRSA designation is based upon the population within the HPSA relative to the number of mental health care providers that service the area. Some areas receive a shortage designation because of the size of its population relative to the number of psychiatrists in the area, while others are designated based upon its population relative to the number of psychiatrists and core mental health providers. For HRSA purposes, core mental health providers include marriage & family therapists, psychiatric nurse specialists, clinical social psychologists, and clinical social workers. Although the population-to-provider ratio necessary to qualify for designation varies by HPSA type (geographic, population or facility), all mental health care shortage areas have a population-to-provider ratio that meets or exceeds certain thresholds stipulated by federal regulations. Areas designated as a mental health care HPSA can participate in federal programs aimed at attracting more mental health care providers to work with these underserved communities. The HRSA estimates that, as of September 30, 2020, all mental health care shortage areas in the U.S. would need about 6,500 more mental health care providers to eliminate all shortage designations.

More than 1,200 HPSAs in the six-state Far West region account for about 14.4% of the U.S. population who live in mental health care shortage areas, and about 13.5% of the national shortage of mental health care providers. The HRSA estimates that HPSAs in the Far West region would need more than 870 additional providers in order to eliminate the mental health care shortage in the region.  Here is a summary look at the mental health care shortage in the Far West region:

The Mental Health Care Shortage in the Far West

State (1) HPSAs (2) Population (3) Shortage
AK 304 377.7 16
CA 536 9,398.5 490
HI 32 516.7 25
NV 53 2,445.6 111
OR 120 1,576.7 82
WA 178 2,836.4 150
Region 1,223 17,151.6 874
U.S. 5,733 119,344.0 6,464

(1) Designated Geographic, Population Group and Facility HPSAs with a mental health care shortage
(2) Population of designated HPSAs, in thousands
(3) Mental Health Care practitioners needed to remove HPSA Designation

Source:  Designated HPSA Quarterly Summary, 9/30/20 (HRSA)

Thursday, January 14, 2021

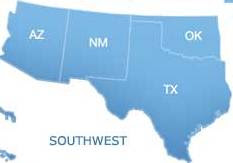
The Dental Care Shortage in the Southwest

September 2020 data published by the Health Resources and Services Administration (HRSA) reveals that almost 60 million Americans live in dental care shortage areas. These areas, called Health Professional Shortage Areas (HPSA) by the HRSA, are geographic areas, population groups, or facilities where access to dental health care services is substandard because of a lack of dental care providers. With respect to dental care, HRSA designation is based upon the number of people living within the HPSA relative to the number of dentists and dental auxiliaries (any non-dentist staff employed by the dentist to assist in the operation of the practice) that service the area. Although the population-to-provider ratio needed to qualify for dental care shortage designation varies by HPSA type (geographic, population or facility), all designated shortage areas have a population-to-provider ratio that meets or exceeds certain limits set by federal regulations. HRSA designated dental care shortage areas are eligible to participate in federal programs aimed at attracting more dental care providers to work with these underserved communities. Nearly 6,500 areas or settings qualified with the HRSA as a dental care shortage area as of September 2020. To eliminate all such shortage designations, the HRSA estimates that these HPSAs would need about 10,700 additional dental care providers.

More than 770 HPSAs in the Southwest region of the country account for about 11.9% of the U.S. population who live in dental care shortage areas and approximately 10.5% of the national shortage of dental care providers. The HRSA estimates that HPSAs in the Southwest would need more than 1,100 additional dental care providers in order to eliminate the dental care shortage in the region. Here is a summary look at the dental care shortage in the Southwest region of the United States:

The Dental Care Shortage in the Southwest

The Dental Care Shortage in the Southwest


State (1) HPSAs (2) Population (3) Shortage
AZ 208 2,338.2 380
NM 98 889.5 174
OK 164 852.5 138
TX 302 3,035.0 431
Region 772 7,115.2 1,123
U.S. 6,487 59,941.1 10,716

(1) Designated Geographic, Population Group and Facility HPSAs with a dental care shortage
(2) Population of designated HPSAs, in thousands
(3) Dental Care practitioners needed to remove HPSA Designation

Source:  Designated HPSA Quarterly Summary, 9/30/20 (HRSA)

Wednesday, January 13, 2021

The Primary Care Shortage in the Southeast

As of September 2020, about 81 million Americans lived in over 7,200 areas or settings that had been designated by the Health Resources and Services Administration (HRSA) as a primary care Health Professional Shortage Area (HPSA). A primary care HPSA is a geographic area, population group, or facility that has poor access to basic health services because it lacks a sufficient number of primary care providers, a category that includes Doctors of Medicine (MD) or Doctors of Osteopathy (DO) who provide services as general or family practitioners, general internal medicine physicians, pediatricians, obstetricians or gynecologists. With respect to primary care, HRSA designation criteria is based upon the population within the HPSA relative to the number of primary care providers that service the area. Although the population-to-provider ratio needed to qualify for designation varies by HPSA type (geographic, population or facility), all primary care shortage areas have a population-to-provider ratio that meets or exceeds certain thresholds stipulated by federal regulations. Areas with a designated primary care shortage can participate in various federal programs aimed at attracting more primary care providers to work in these medically underserved communities. The HRSA estimates that, as of September 2020, all primary care HPSAs in the U.S. would need about 15,000 more providers to eliminate all shortage designations.

HPSAs in the twelve-state Southeast region of the country account for just over 33% of the U.S. population who live in primary care shortage areas and approximately 32% of the national shortage of primary care providers. The HRSA estimates that the Southeast region would need over 4,700 more primary care providers to eliminate the shortage that exists in the region. Here is a summary look at the primary care shortage in the Southeast:

The Primary Care Shortage in the Southeast

State (1) HPSAs (2) Population (3) Shortage
AL 102 2,295.3 316
AR 88 647.7 93
FL 279 6,657.5 1,793
GA 234 3,202.8 636
KY 175 1,348.0 180
LA 154 2,251.2 248
MS 148 1,732.5 315
NC 189 2,028.1 323
SC 95 1,911.0 250
TN 136 2,440.5 263
VA 113 1,849.5 214
WV 105 639.4 117
Region 1,818 27,003.5 4,748
U.S. 7,203 81,516.3 14,945

(1) Designated Geographic, Population Group and Facility HPSAs with a primary care shortage
(2) Population of designated HPSAs, in thousands
(3) Primary Care practitioners needed to remove HPSA Designation

Source:  Designated HPSA Quarterly Summary, 9/30/20 (HRSA)

Tuesday, January 12, 2021

CHIP and Medicaid Child Enrollment in the Great Lakes Region

The National Health Interview Survey (2019) revealed that about 41% of children under the age of 18 in the U.S. have health insurance coverage funded all or in part by taxpayer dollars. While health benefit programs for local, state and federal government employees, including military personnel, account for some of the child enrollment in taxpayer funded health insurance plans, the vast majority of such coverage is provided by Medicaid and the Children's Health Insurance Program (CHIP). Medicaid is the joint state-federal health insurance program for eligible Americans with limited income and resources.  CHIP is a similar joint state-federal effort, one aimed at making available health insurance for children from poor families with incomes too high to qualify for Medicaid coverage.  Federal reports from September 2020 reveal that there were about 37.4 million individuals who were either enrolled in CHIP or who were children enrolled in the Medicaid program.

That September 2020 data tells us that the five-state Great Lakes region accounted for 10.9% of the U.S. children who were enrolled in CHIP and 14.0% of U.S. children enrolled in the Medicaid program.  Here is a summary look at CHIP and Medicaid Child enrollment in the Great Lakes region:

CHIP and Medicaid Child Enrollment in the Great Lakes Region

CHIP and Medicaid Child Enrollment in the Great Lakes Region

State (1) CHIP (2) Medicaid Child Total
IL 299.1 1,105.2 1,404.3
IN 109.7 746.4 856.1
MI 58.6 934.6 993.2
OH 194.6 1,042.5 1,237.1
WI 70.5 475.3 545.8
Region 732.5 4,304.0 5,036.5
U.S. 6,719.1 30,641.9 37,361.0

(1) CHIP enrollment, in thousands
(2) Children enrolled in Medicaid plans, in thousands (derived by deducting State reported CHIP enrollment from State Reported Total Medicaid Child and CHIP enrollment)

Source: Medicaid.gov Enrollment Reports as of September, 2020

Friday, January 8, 2021

The Mental Health Care Shortage in the Great Plains Region

According to September 2020 data published by the Health Resources and Services Administration (HRSA), over 119 million Americans live in more than 5,700 areas or settings designated as a Health Professional Shortage Area (HPSA) for mental health care services. A mental health care HPSA is a geographic area, population group, or facility where access to mental health care is substandard because it lacks a sufficient number of mental health care providers. With respect to mental health care, HRSA designation is based upon the population within the HPSA relative to the number of mental health care providers that service the area. Some areas receive a shortage designation because of the size of its population relative to the number of psychiatrists in the area, while others are designated based upon its population relative to the number of psychiatrists and core mental health providers. For HRSA purposes, core mental health providers include clinical social psychologists, clinical social workers, marriage & family therapists and psychiatric nurse specialists. Although the population-to-provider ratio necessary to qualify for designation varies by HPSA type (geographic, population or facility), all mental health care HPSAs have a population-to-provider ratio that meets or exceeds certain thresholds stipulated by federal regulations. Areas designated as a mental health care HPSA can participate in federal programs aimed at attracting more mental health care providers to work with these medically underserved communities. The HRSA estimates that, as of September 30, 2020, all mental health care HPSAs in the U.S. would need about 6,500 more mental health care providers to eliminate all shortage designations.

More than 780 HPSAs in the seven-state Great Plains region account for about 7.2% of the U.S. population who live in mental health care shortage areas, and about 6.5% of the national shortage of mental health care providers. The HRSA estimates that HPSAs in the Great Plains region would need over 400 more providers in order to eliminate the mental health care shortage in the region.  Here is a summary look at the mental health care shortage in the Great Plains region:

The Mental Health Care Shortage in the Great Plains Region

State (1) HPSAs (2) Population (3) Shortage
IA 90 1,821.3 62
KS 128 1,383.3 54
MN 116 1,784.0 76
MO 246 1,871.9 143
NE 72 1,038.0 26
ND 71 303.0 22
SD 61 448.3 36
Region 784 8,649.8 419
U.S. 5,733 119,344.0 6,464

(1) Designated Geographic, Population Group and Facility HPSAs with a mental health care shortage
(2) Population of designated HPSAs, in thousands
(3) Mental Health Care practitioners needed to remove HPSA Designation

Source:  Designated HPSA Quarterly Summary, 9/30/20 (HRSA)

Thursday, January 7, 2021

The Dental Care Shortage in the Great Lakes Region

Health Resources and Services Administration (HRSA) data from September 2020 reveals that almost 60 million Americans live in dental care shortage areas. These areas, known by the HRSA as a Health Professional Shortage Area (HPSA), are geographic areas, population groups, or facilities where access to healthcare services is substandard because of a lack of primary care, dental care, or mental health care providers. With respect to dental care, HRSA designation is based upon the number of people living within the HPSA relative to the number of dentists and dental auxiliaries (any non-dentist staff employed by the dentist to assist in the operation of the practice) that service the area. Although the population-to-provider ratio needed to qualify for dental care shortage designation varies by HPSA type (geographic, population or facility), all HPSAs so designated have a population-to-provider ratio that meets or exceeds certain thresholds set by federal regulations. HRSA designated dental care shortage areas are eligible to participate in federal programs aimed at attracting more dental care providers to work with these communities. Nearly 6,500 areas or settings qualified with the HRSA as a dental care shortage area as of September 2020. To eliminate all such shortage designations, the HRSA estimates that these HPSAs would need about 10,700 additional dental care providers.

More than 800 HPSAs in the Great Lakes region account for about 14.0% of the U.S. population who live in dental care shortage areas and approximately 14.3% of the national shortage of dental care providers. The HRSA estimates that HPSAs in the Great Lakes region would need more than 1,500 additional dental care providers in order to eliminate the dental care shortage in the region. Here is a summary look at the dental care shortage in the Great Lakes region of the United States:

The Dental Care Shortage in the Great Lakes Region

The Dental Care Shortage in the Great Lakes Region

State (1) HPSAs (2) Population (3) Shortage
IL 208 2,303.6 381
IN 104 1,304.4 227
MI 243 1,732.9 420
OH 145 1,802.1 302
WI 111 1,226.4 206
Region 811 8,369.4 1,536
U.S. 6,487 59,941.1 10,716

(1) Designated Geographic, Population Group and Facility HPSAs with a dental care shortage
(2) Population of designated HPSAs, in thousands
(3) Dental Care practitioners needed to remove HPSA Designation

Source:  Designated HPSA Quarterly Summary, 9/30/20 (HRSA)