Monday, November 30, 2020

Massachusetts General Hospital, our trusted link for November, 2020

Massachusetts General Hospital is the oldest and largest teaching hospital of Harvard Medical School. Opened as a public hospital in Boston in 1821, its 200 years of innovations include

  • among the earliest users of surgical anesthesia 
  • identification of appendicitis
  • establishment of the 1st medical social service
  • 1st replantation of a severed arm. 

Mass General has the largest hospital-based research organization in the country, with a $1 billion budget in 2019. Over 9,500 researchers work in over 30 programs. It receives more funding from the National Institutes of Health than any other independent hospital system. Their most well-known and unique programs include

Mass General was ranked #6 in U.S. News Best Hospitals report, and all 16 of its specialties were ranked.

  • #2 in diabetes and endocrinology
  • #2 in rehabilitation (at its Spaulding hospital)
  • #3 in psychiatry

You can subscribe to three general research news publications

Explore memorable moments at Mass General

The Mental Health Care Shortage in New England

September 30, 2020 data from the Health Resources and Services Administration (HRSA) reveals that more than 119 million Americans lived in over 5,700 areas or settings designated as a Health Professional Shortage Area (HPSA) for mental health care services. An HPSA is a geographic area, population group, or facility where access to healthcare services is substandard because it lacks a sufficient number of primary care, dental or mental health care providers. With respect to mental health care, HRSA designation criteria is based upon the population within the HPSA relative to the number of mental health care providers that service the area. Certain areas receive a shortage designation based on its population relative to the number of psychiatrists in the area, while others are designated based upon its population relative to the number of psychiatrists and core mental health providers. For HRSA purposes, core mental health providers include clinical social psychologists, clinical social workers, psychiatric nurse specialists, and marriage & family Therapists. Although the population-to-provider ratio needed to qualify for designation varies by HPSA type (geographic, population or facility), all HPSAs with a mental health care shortage designation have a population-to-provider ratio that meets or exceeds certain thresholds stipulated by federal regulations. Areas designated as an HPSA are eligible to participate in federal programs aimed at attracting more mental health care providers to work with these medically underserved populations. The HRSA estimates that, as of September 30, 2020, all mental health care HPSAs in the U.S. would need about 6,500 more mental health care providers to eliminate all shortage designations.

HPSAs in New England account for about 1.8% of the U.S. population who live in mental health care shortage areas.  The HRSA estimates that HPSAs in New England would need 120 more mental health care providers in order to eliminate the mental health care shortage in the region.  Here is a summary look at the mental health care shortage in New England:

The Mental Health Care Shortage in New England

The Mental Health Care Shortage in New England

State (1) HPSAs (2) Population (3) Shortage
CT 37 1,122.6 62
ME 58 260.9 29
MA 53 273.1 17
NH 21 92.5 3
RI 13 424.0 9
VT 11 N/A N/A
Region 193 2,173.0 120
U.S. 5,733 119,344.0 6,464

(1) Designated Geographic, Population Group and Facility HPSAs with a mental health care shortage
(2) Population of designated HPSAs, in thousands
(3) Mental Health Care practitioners needed to remove HPSA Designation

Source:  Designated HPSA Quarterly Summary, 9/30/20 (HRSA)

Sunday, November 29, 2020

The Dental Care Shortage in the Great Plains Region

According to September 30, 2020 data from the Health Resources and Services Administration (HRSA), nearly 60 million Americans lived in over 6,400 areas or settings designated as a dental care Health Professional Shortage Area (HPSA). An HPSA is a geographic area, population group, or facility where access to healthcare services is substandard because it lacks a sufficient number of primary care, dental or mental health care providers. In the case of dental care, HRSA designation criteria is based upon the population within the HPSA relative to the number of dental care providers that service the area. For HRSA purposes, dental care providers include Dentists and dental auxiliaries (any non-dentist staff employed by the dentist to assist in the operation of the practice). Although the population-to-provider ratio needed to qualify for designation varies by HPSA type (geographic, population or facility), all HPSAs with a dental care shortage designation have a population-to-provider ratio that meets or exceeds certain thresholds set by federal regulations. Areas designated as an HPSA are eligible to participate in federal programs aimed at attracting more dental care providers to work with these medically underserved populations. The HRSA estimates that, as of September 30, 2020, all dental care HPSAs in the U.S. would need about 10,700 more dental care providers to eliminate all shortage designations.

HPSAs in the seven-state Great Plains region account for about 6.3% of the U.S. population who live in dental care shortage areas.  The HRSA estimates that HPSAs in the Great Plains states would need just over 700 more dental care providers in order to eliminate the dental care shortage in the region.  Here is a summary look at the dental care shortage in the Great Plains region:

The Dental Care Shortage in the Great Plains Region

State (1) HPSAs (2) Population (3) Shortage
IA 131 412.9 66
KS 182 601.1 78
MN 171 768.1 144
MO 314 1,725.2 373
NE 68 1.7 0
ND 66 127.7 14
SD 71 151.2 32
Region 1,003 3,787.9 707
U.S. 6,487 59,941.1 10,716

(1) Designated Geographic, Population Group and Facility HPSAs with a dental care shortage
(2) Population of designated HPSAs, in thousands
(3) Dental Care practitioners needed to remove HPSA Designation

Source:  Designated HPSA Quarterly Summary, 9/30/20 (HRSA)

Saturday, November 28, 2020

The Primary Care Shortage in the Great Lakes Region

As of September 30, 2020, more than 81 million Americans lived in over 7,200 areas or settings designated by the Health Resources and Services Administration (HRSA) as a primary care Health Professional Shortage Area (HPSA). An HPSA is a geographic area, population group, or facility that has poor access to healthcare services because it lacks a sufficient number of primary care, dental or mental health care providers. In the primary care realm, HRSA designation criteria is based upon the population within the HPSA relative to the number of primary care providers that service the area. For HRSA purposes, primary care providers include Doctors of Medicine (MD) or Doctors of Osteopathy (DO) who provide services as general or family practitioners, general internal medicine physicians, pediatricians, obstetricians or gynecologists. Although the population-to-provider ratio needed to qualify for designation varies by HPSA type (geographic, population or facility), all HPSAs with a primary care shortage designation have a population-to-provider ratio that meets or exceeds certain thresholds established by federal regulations. Areas designated as an HPSA are eligible to participate in federal programs aimed at attracting more primary care providers to work with these medically underserved populations. The HRSA estimates that, as of September 30, 2020, all primary care HPSAs in the U.S. would need nearly 15,000 more providers to eliminate all shortage designations.

HPSAs in the five-state Great Lakes region account for just under 14% of the U.S. population who live in primary care shortage areas.  To eliminate the shortage, the HRSA estimates that Great Lakes region HPSAs would need nearly 1,600 more primary care providers.  Here is a summary look at the primary care shortage in  the Great Lakes region:

The Primary Care Shortage in the Great Lakes Region

The Primary Care Shortage in the Great Lakes Region

State (1) HPSAs (2) Population (3) Shortage
IL 245 3,229.4 483
IN 117 2,112.4 167
MI 261 2,983.9 574
OH 150 1,768.3 213
WI 105 1,135.0 149
Region 878 11,229.0 1,586
U.S. 7,203 81,516.3 14,945

(1) Designated Geographic, Population Group and Facility HPSAs with a primary care shortage
(2) Population of designated HPSAs, in thousands
(3) Primary Care practitioners needed to remove HPSA Designation

Source:  Designated HPSA Quarterly Summary, 9/30/20 (HRSA)

Friday, November 27, 2020

The Covid-19 Pandemic and Medicaid Enrollment in the Southwest

Thanks to strong economic conditions in recent years prior to 2020, Medicaid, the nation's health insurance program for eligible individuals with limited income and resources, had been experiencing a slight downtrend in enrollment. Medicaid agencies, which administer the program in each state, anticipated more of the same in 2020. Those expectations quickly changed as the Covid-19 outbreak, which began in China in late 2019, began spreading across the nation. Before the new year was even a month old, U.S. officials had declared a public health emergency and soon thereafter efforts to bring the outbreak under control began. Americans soon discovered that measures to control the spread of Covid-19 had a terrible byproduct: an unprecedent, and still ongoing, disruption of business activity and widespread economic hardship for millions. In contrast to pre-pandemic expectations of minimal enrollment growth, between widespread economic hardship for many individuals and federal efforts to support health insurance coverage during a public health crisis, Medicaid rolls surged during the first half of 2020.   The most recently published Medicaid enrollment data, which is current as of 7/1/20, reveals national enrollment growth of 6.5%, or more than 4 million people, since the beginning of 2020. Given the extent of the economic hardships and the uncertainty about the duration of such conditions, Medicaid agencies now forecast still more growth in enrollment in the current fiscal year that began this past July.  

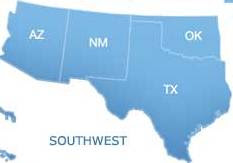
Every region of the U.S. has seen a bump in its Medicaid enrollment numbers since the Covid-19 pandemic began. In the four-state Southwest region, the impact of the Covid-19 outbreak has been the most severe of any region in the country.  During the first half of 2020, Medicaid enrollment in the region grew 8.9%, as compared to the 6.5% enrollment growth nationally. Here's a quick look at Medicaid enrollment growth at the state and regional level in the Southwest during the first half of 2020:


The Covid-19 Pandemic and Medicaid Enrollment in the Southwest

The Covid-19 Pandemic and Medicaid Enrollment in the Southwest


Medicaid Enrollment (in 000s)
State July 1, 2020 Jan 1, 2020 Growth
AZ 1,754.6 1,605.9 9.3%
NM 742.2 706.1 5.1%
OK 680.4 600.2 13.4%
TX 3,931.2 3,617.1 8.7%
SW Only 7,108.3 6,529.3 8.9%
National 68,826.6 64,621.4 6.5%

Source: Medicaid.gov Enrollment Reports.

Monday, November 23, 2020

Medicare Advantage Enrollment Growth in the Rocky Mountain Region

With the Medicare open enrollment period now underway through December 7th, many Medicare seniors will be contemplating a switch in their Medicare coverage to a Medicare Advantage (MA) plan. MA Plans are a type of health plan, increasingly popular among Medicare eligible individuals, that are offered by private insurers as an alternative to original Medicare.  MA plans are offered through private insurers that contract with the federal government to provide an alternative to Medicare Part A and Part B benefits coverage. What gives MA plans their growing appeal is that private insurers have been able to bundle these Part A and Part B benefits with a variety of extra benefits, at little to no cost to enrollees.

With lower costs and added benefits, MA plans can provide exceptional value compared to Original Medicare.  The added value offered by MA plans is made possible, in part, by requiring plan participants to comply with managed care protocols and to use narrower provider networks, plan features not found with Original Medicare coverage.  While MA Plans can come in various insurance models, the most popular MA plans feature HMO and PPO structures.  Notwithstanding managed care protocols and fewer provider choices, more and more Medicare eligible seniors are migrating to MA plans because of the value they offer.  As of October 2020, across all 50 states there were about 24 million Americans enrolled in MA plans, an increase of more than 40% in the past 4 years.  During this same timeframe, total Medicare enrollment across all 50 states has grown only about 10%, so faster MA plan growth has translated into a growing share of the Medicare market for Medicare Advantage plans, from just 30% four years ago to 39% today.

The growing popularity of MA plans is readily evident in the five-state Rocky Mountain region, where MA enrollment over the past four years has grown nearly 40%. Here is a closer look at Medicare Advantage enrollment growth in the Rocky Mountain region over the last four years:

Medicare Advantage Enrollment Growth in the Rocky Mountain Region

Medicare Advantage Enrollment Growth in the Rocky Mountain Region


Medicare Eligible (in thousands) MA Enrollment (in thousands) % Growth
State 2020 2016 2020 2016 Eligible MedAdv
CO 943.6 829.9 399.9 274.4 13.7% 45.7%
ID 348.9 294.7 129.9 93.7 18.4% 38.7%
MT 238.7 209.6 48.6 41.6 13.8% 16.8%
UT 415.3 359.3 167.2 123.7 15.6% 35.1%
WY 114.4 98.9 4.3 2.6 15.7% 67.2%
RM Only 2,060.9 1,792.5 749.9 536.0 15.0% 39.9%
All States 61,584 55,972 24,050 16,909 10.0% 42.2%

For a summary look at MA plan enrollment growth in other states, check out our resource page Medicare Advantage Enrollment Growth.

Sunday, November 22, 2020

Covid-19's Impact on Medicaid Enrollment in the MidEast Region

In a previous commentary, we examined the impact of Covid-19 on enrollment in Medicaid, the joint federal-state health insurance program for eligible individuals with limited income and resources. Historically, Medicaid enrollment increases during periods of economic hardship. Weak economic conditions produce more unemployment, more people without work-related health insurance, more people in lower income households, and more people who are eligible for health insurance coverage through the Medicaid program. Conversely, enrollment tends to drop off or decline when the economy is robust and expanding.

As in previous economic downturns, the Covid-19 induced recession has sparked a jump in Medicaid enrollment. Moreover, agencies that manage the Medicaid program in each state now forecast still more enrollment growth in the months ahead. Every region of the U.S. has experienced a jump in its Medicaid enrollment numbers since the Covid-19 pandemic began. In the MidEast region, Covid-19's impact on Medicaid enrollment has been less severe than in other sections of the country. That said, after several years of stagnant enrollment numbers, in the first half of 2020 Medicaid enrollment in the region grew 5.8%, as compared to 6.5% nationally. Here's a quick look at Medicaid enrollment growth at the state and regional level in the MidEast region during the first half of 2020:

Covid-19's Impact on Medicaid Enrollment in the MidEast Region

Covid-19's Impact on Medicaid Enrollment in the MidEast Region

Medicaid Enrollment (in 000s)
State July 1, 2020 Jan 1, 2020 Growth
DE 230.7 219.0 5.3%
DC 232.9 235.4 -1.1%
MD 1,245.0 1,188.2 4.8%
NJ 1,548.5 1,474.0 5.1%
NY 5,750.8 5,397.6 6.5%
PA 2,914.5 2,755.4 5.8%
ME Only 11,922.3 11,269.6 5.8%
National 68,826.6 64,621.4 6.5%

Source: Medicaid.gov Enrollment Reports.

Saturday, November 21, 2020

EMT-Paramedic Pay in the Top 20 Metro Markets

There were approximately 260,000 emergency medical technicians (EMTs) and paramedics working in the U.S. as of May 2019 according to U.S. Bureau of Labor Statistics (BLS) reports.  EMTs and paramedics mostly work for ambulatory healthcare service providers and hospitals, with smaller numbers employed in physician offices and outpatient care centers. EMTs and paramedics earn lower salaries and wages than workers in most other occupations.  According to BLS data, as of May 2019 the national mean wage for EMTs and paramedics was $38,830 annually, in comparison to the $53,490 annual mean wage the average worker in all occupations in the U.S.  Pay for the profession varies widely from region-to-region, with EMTs and paramedics in some areas making 50% or more annually than their counterparts elsewhere. This salary and wage disparity is readily seen in BLS data from May 2019, which reports the following about EMT-Paramedic pay in the top 20 metro markets in the U.S.:

Metropolitan Area # Employed Annual Mean Wages
1 New York-Newark-Jersey City 17,560 $45,420
2 Los Angeles-Long Beach-Anaheim 6,610 $41,910
3 Chicago-Naperville-Elgin 7,940 $49,070
4 Dallas-Fort Worth-Arlington 4,200 $36,580
5 Houston-The Woodlands-Sugar Land 4,670 $37,270
6 Washington-Arlington-Alexandria 2,340 $49,150
7 Miami-Fort Lauderdale-Pompano Beach 3,120 $33,790
8 Philadelphia-Camden-Wilmington 6,260 $38,280
9 Atlanta-Sandy Springs-Alpharetta 4,930 $36,930
10 Phoenix-Mesa-Chandler 2,160 $38,380
11 Boston-Cambridge-Newton 4,340 $42,400
12 San Francisco-Oakland-Berkeley 3,550 $54,180
13 Riverside-San Bernardino-Ontario 3,180 $40,700
14 Detroit-Warren-Dearborn 2,560 $36,270
15 Seattle-Tacoma-Bellevue 2,360 $55,990
16 Minneapolis-St. Paul-Bloomington 2,420 $47,110
17 San Diego-Chula Vista-Carlsbad 1,890 $36,450
18 Tampa-St. Petersburg-Clearwater 2,010 $36,820
19 Denver-Aurora-Lakewood 2,070 $44,550
20 St. Louis 3,230 $35,950
National 260,600 $38,830

Source: U.S. Bureau of Labor Statistics OES. Data extracted on November 13, 2020

Thursday, November 19, 2020

Medicare Advantage Growth in the Great Plains States

The Medicare open enrollment period is now underway through December 7th. During this period, many Medicare beneficiaries will contemplate switching their Medicare coverage to a Medicare Advantage (MA) plan. MA Plans are an increasingly popular type of health plan offered by private insurers as an alternative to original Medicare.  MA plans are offered through private insurers that contract with the federal government to provide an alternative to Medicare Part A and Part B benefits coverage. What gives MA plans their growing appeal is that private insurers have been able to bundle these Part A and Part B benefits with a variety of extra benefits, at little to no cost to enrollees.

Given lower costs and extra benefits, Medicare Advantage plans can provide great value compared to Original Medicare.  The extra value offered by MA plans is made possible, in part, by requiring plan participants to use narrower provider networks and to comply with managed care protocols that are not found with Original Medicare coverage.  While MA Plans can come in various insurance models, the most popular MA plans feature PPO and HMO structures.  Despite managed care requirements and fewer provider choices, more and more Medicare eligible seniors are switching to Medicare Advantage plans because of the value they offer.  As of October 2020, across all 50 states there were about 24 million Americans enrolled in MA plans, an increase of more than 40% in the past 4 years.  During this same timeframe, total Medicare enrollment across all 50 states has grown only about 10%, so the faster MA plan enrollment growth has translated into a growing share of the Medicare market for MA plans, from just 30% four years ago to 39% today.

The growing popularity of Medicare Advantage plans is even more evident in the Great Plains states, where MA enrollment over the past four years has grown over 82%, nearly double the growth rate nationally. Here is a closer look at Medicare Advantage growth in the Great Plains states over the last four years:


Medicare Advantage Growth in the Great Plains States

Medicare Eligible (in thousands) MA Enrollment (in thousands) % Growth
State 2020 2016 2020 2016 Eligible MedAdv
IA 639.7 588.7 149.0 92.5 8.7% 61.2%
KS 548.1 500.2 116.5 70.7 9.6% 64.8%
MN 1,050.7 949.8 454.4 160.5 10.6% 183.1%
MO 1,251.5 1,167.7 506.0 349.7 7.2% 44.7%
NE 354.8 324.0 68.0 38.3 9.5% 77.5%
ND 135.0 121.5 6.4 2.0 11.0% 220.0%
SD 181.1 162.1 17.4 8.3 11.7% 109.8%
GP Only 4,160.8 3,814.1 1,317.8 722.0 9.1% 82.5%
All States 61,584 55,972 24,050 16,909 10.0% 42.2%

For a summary look at MA plan enrollment growth in other states, check out our resource page Medicare Advantage Enrollment Growth.

Wednesday, November 18, 2020

Covid-19 and Medicaid Enrollment in the Far West Region

In an earlier commentary, we examined the impact of the Covid-19 outbreak on enrollment in Medicaid, the national health insurance program for eligible individuals with limited income and resources. Historically, Medicaid enrollment increases during economic downturns. Soft economic conditions create more unemployment, more people without employer-sponsored health insurance, more people with lower household incomes, and more people who qualify for health insurance coverage through the Medicaid program. This is in contrast to periods of robust economic activity, when enrollment tends to drop off and even decline.

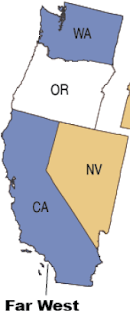
Like previous economic downturns, the Covid-19 induced contraction of economic activity has seen a jump in Medicaid enrollment, and agencies that manage the Medicaid program in each state now forecast still more growth in enrollment. After recent years of stagnant enrollment numbers, every region of the U.S. has witnessed a bump in its Medicaid enrollment since the Covid-19 outbreak began. In the six-state Far West region, the impact of the Covid-19 outbreak has been less severe than in other sections of the country, as Medicaid enrollment in the region grew 4.2%, as compared to 6.5% nationally, during the first half of 2020. Here's a quick look at Medicaid enrollment growth at the state and regional level in the Far West region during the first half of 2020:

Covid-19 and Medicaid Enrollment in the Far West Region

Medicaid Enrollment (in 000s)
State July 1, 2020 Jan 1, 2020 Growth
AK 218.5 207.3 5.4%
CA 10,615.8 10,300.6 3.1%
HI 332.5 300.2 10.8%
NV 657.5 586.1 12.2%
OR 935.5 870.9 7.4%
WA 1,733.9 1,642.8 5.5%
FW Only 14,493.7 13,907.8 4.2%
National 68,826.6 64,621.4 6.5%

Source: Medicaid.gov Enrollment Reports.

Sunday, November 15, 2020

The Growth of Medicare Advantage Plans in New England

The Medicare open enrollment period is underway through December 7th. During this open enrollment period many Medicare eligible seniors will be considering a change in their Medicare coverage to a Medicare Advantage (MA) plan. MA Plans are a type of health plan offered by private insurers as an alternative to original Medicare.  MA plans are offered through private insurance companies that contract with the federal government to offer an alternative to Medicare Part A and Part B benefits coverage. With these MA plans, the U.S. government basically contracts private insurers to offer Medicare eligible individuals health plans that, at a minimum, match Original Medicare Part A and Part B benefits.  MA plans have grown increasingly popular as private insurers have been able to effectively bundle Part A and Part B benefits, plus a variety of extra benefits, into their MA plans at minimal to no cost to enrollees.

With lower costs and more benefits, MA plans can be an excellent value compared to Original Medicare.  The additional value that comes with MA plans is usually made possible, in part, by requiring enrollees to use more restricted provider networks and to adhere to managed care protocols, plan features that are not found with Original Medicare coverage.  While MA Plans can come in several insurance models, the most popular such plans feature HMO and PPO structures.  Despite managed care protocols and fewer provider choices, increasing numbers of Medicare eligible seniors have been migrating to Medicare Advantage plans because of the value they offer.  As of October 2020, across all 50 states there were about 24 million Americans enrolled in MA plans, an increase of more than 40% in the past 4 years.  During this same four year period total Medicare enrollment across all 50 states only grew about 10%, so with MA enrollment expanding faster than overall Medicare enrollment, MA's share of the Medicare market has seen material growth, from about 30% four years ago to 39% today.

MA plan enrollment has grown even faster in the New England states than it has nationally. In the past four years, Medicare Advantage enrollment has grown 62% in New England as compared to 42% growth nationally.  Here is a closer look at the growth of Medicare Advantage plans in New England over the last four years:


The Growth of Medicare Advantage Plans in New England

The Growth of Medicare Advantage Plans in New England

Medicare Eligible (in thousands) MA Enrollment (in thousands) % Growth
State 2020 2016 2020 2016 Eligible MedAdv
CT 693.3 643.9 314.9 172.2 7.7% 82.9%
MA 1,356.7 1,250.9 334.6 249.7 8.5% 34.0%
ME 348.2 315.3 152.5 80.3 10.4% 89.8%
NH 308.5 273.9 68.2 22.6 12.6% 201.9%
RI 225.3 208.5 95.7 73.6 8.1% 29.9%
VT 151.8 135.9 22.1 10.4 11.7% 112.7%
NE Only 3,084 2,828 987.9 608.8 9.0% 62.3%
All States 61,584 55,972 24,050 16,909 10.0% 42.2%

For a summary look at MA plan enrollment growth in other states, check out our resource page Medicare Advantage Enrollment Growth.