Thursday, September 30, 2021

Physical Therapist Pay in the Rocky Mountain Region

Recently published U.S. Bureau of Labor Statistics (BLS) data put the number of physical therapists (PTs) employed in the U.S. at nearly 221,000 as of May 2020.  The five-state Rocky Mountain region accounted for about 9,800 physical therapist jobs according to the BLS data.  The Rocky Mountain region is a relatively poor one for physical therapist pay, with no states in the region having PT annual mean wage levels higher than the national average.  Moreover, two states in the region ranked among the ten worst states in the nation physical therapist annual mean wages.  A deeper look at BLS data from May 2020 reveals the following about physical therapist pay in the Rocky Mountain region:

Physical Therapist Pay in the Rocky Mountain Region

Physical Therapist Pay in the Rocky Mountain Region


State # Employed Annual Mean Wages Wage Rank*
CO 5,130 $87,250 32nd
ID 1,190 $82,470 49th
MT 1,120 $84,600 45th
UT 1,840 $86,780 35th
WY 480 $90,140 24th
U.S. 220,870 $91,680 -------

(*) annual mean wage ranking among the 50 states and the District of Columbia

Source: U.S. Bureau of Labor Statistics OES. Data extracted on May 2, 2021

Wednesday, September 29, 2021

Cancer Deaths in New England

Responsible for more than 599,000 deaths in 2019 (about 21% of all deaths in the United States that year), cancer is the second leading cause of death in the nation.  Thanks to advancements in treatment and early diagnosis, the cancer death rate has declined modestly in the twenty years from 1999 to 2019. At 197.0 cancer deaths per 100,000 population in 1999, by 2019 the death rate from cancer had dropped 7.3%, to 182.7 deaths per 100,000 population.  The favorable trend in the cancer death rate at the national level was also seen in the New England region.  The region, which historically has a higher cancer death rate than most other regions of the country, saw its cancer death rate drop more than 10% between 1999 and 2019, from 217.3 deaths per 100,000 population to 194.7 deaths per 100,000 population.  A closer look at data from the National Center for Health Statistics details the following about cancer deaths in New England:

Cancer Deaths in New England

Cancer Deaths in New England

Area/Deaths 1999 2009 2019
CT 7,054 6,819 6,496
MA 13,853 13,112 12,582
ME 3,035 3,133 3,413
NH 2,408 2,562 2,819
RI 2,463 2,220 2,210
VT 1,255 1,254 1,378
Region 30,068 29,100 28,898
U.S. 549,838 567,628 599,601
Area/Death Rate* 1999 2009 2019
CT 208.3 191.4 182.2
MA 219.3 201.2 182.5
ME 239.6 235.6 253.9
NH 197.1 194.7 207.3
RI 236.7 210.7 208.6
VT 207.5 200.7 220.8
Region 217.3 202.0 194.7
U.S. 197.0 185.0 182.7

(*) number of cancer deaths per 100,000 population

Source: CDC Wonder. Centers for Disease Control and Prevention, National Center for Health Statistics. Underlying Cause of Death 1999-2019 on CDC WONDER Online Database, released in 2020. Data are from the Multiple Cause of Death Files, 1999-2019, as compiled from data provided by the 57 vital statistics jurisdictions through the Vital Statistics Cooperative Program. Accessed on July 17, 2021

Tuesday, September 28, 2021

Pharmacist Pay in the Southeastern U.S.

May 2020 data published earlier this summer by the U.S. Bureau of Labor Statistics (BLS) put the number of pharmacists working in the United States at over 315,000.  The twelve-state Southeastern U.S. was home to over 82,000 employed pharmacists as of May 2020.  With only one state having a pharmacist annual mean wage level above the national average, and four states in the region ranking among the bottom ten states nationally for pharmacist annual mean wages, the Southeastern U.S. is a generally subpar region for pharmacist pay.  A more detailed examination of BLS data from May 2020 reveals the following about pharmacist pay in the Southeastern U.S.:

Pharmacist Pay in the Southeastern U.S.

State # Employed Annual Mean Wages Wage Rank*
AL 4,680 $124,170 22nd
AR 3,010 $120,040 42nd
FL 20,200 $121,310 33rd
GA 8,700 $118,900 45th
KY 4,940 $121,680 31st
LA 5,440 $123,350 26th
MS 2,560 $121,100 37th
NC 10,110 $123,770 24th
SC 5,370 $119,090 44th
TN 7,620 $118,880 46th
VA 7,810 $125,390 17th
WV 2,000 $129,440 9th
U.S. 315,470 $125,460 -------

(*) annual mean wage ranking among the 50 states and the District of Columbia

Source: U.S. Bureau of Labor Statistics OES. Data extracted on May 2, 2021

Monday, September 27, 2021

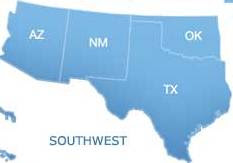
Licensed Practical Nurse Pay in the Southwest

U.S. Bureau of Labor Statistics (BLS) data published earlier this year put licensed practical nurse (LPN) employment at more than 676,000 as of May 2020.  Also known as license vocational nurses (LVNs) in some areas of the country, licensed practical nurses make up one of the biggest healthcare occupations in the U.S.  As of May 2020, nearly 92,000 LPNs were working in the four-state Southwestern region of the country. Further examination of May 2020 BLS data reveals the following about licensed practical nurse pay in the Southwest:

Licensed Practical Nurse Pay in the Southwest

Licensed Practical Nurse Pay in the Southwest


State # Employed Annual Mean Wages Wage Rank*
AZ 7,440 $55,820 13th
NM 1,900 $50,480 21st
OK 12,850 $43,250 44th
TX 69,650 $48,380 27th
U.S. 676,440 $50,090 -------

(*) annual mean wage ranking among the 50 states and the District of Columbia

Source: U.S. Bureau of Labor Statistics OES. Data extracted on April 26, 2021

Friday, September 24, 2021

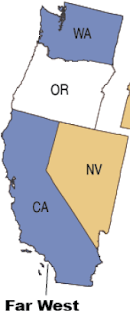
Occupational Therapist Pay in the Far West U.S.

U.S. Bureau of Labor Statistics (BLS) data released earlier this year indicated that, as of May 2020, there were over 126,600 occupational therapists (OTs) at work in the United States.  As that time, occupational therapist employment in the Far West U.S. totaled just over 15,100.  BLS data reveals the Far West region to be one of the best in the nation in terms of OT pay.  More than 80% of OTs working the region lived in a state where the OT annual mean wage level was above the national average.  This included two states, Nevada and California, that ranked as the two best states in the nation for occupational therapist annual mean wages.  A deeper dive into the BLS data reveals the following about occupational therapist pay in the Far West U.S. as of May 2020:

Occupational Therapist Pay in the Far West U.S.

Occupational Therapist Pay in the Far West U.S.

State # Employed Annual Mean Wages Wage Rank*
AK 270 $93,980 7th
CA 9,840 $101,080 2nd
HI 300 $85,900 22nd
NV 850 $111,270 1st
OR 1,320 $90,940 12th
WA 2,590 $87,320 17th
U.S. 126,610 $87,480 -------

(*) annual mean wage ranking among the 50 states and the District of Columbia

Source: U.S. Bureau of Labor Statistics OES. Data extracted on April 26, 2021

Thursday, September 23, 2021

Physician Assistant Pay in the Great Lakes Region

May 2020 data published earlier this year by the U.S. Bureau of Labor Statistics (BLS) put the number of physician assistants (PA) employed in the U.S. at just over 125,000.  As of that time, the five-state Great Lakes region was home to a bit more than 16,000 physician assistants according to the BLS.  BLS data revealed the region to be weak one for physician assistant pay, as the PA annual mean wage level in each state in the region was below the national average.  A closer examination of BLS data from May 2020 revealed the following about physician assistant pay in the Great Lakes region:

Physician Assistant Pay in the Great Lakes Region

Physician Assistant Pay in the Great Lakes Region

State # Employed Annual Mean Wages Wage Rank*
IL 3,160 $110,190 34th
IN 1,650 $102,030 44th
MI 4,350 $111,050 32nd
OH 4,440 $107,600 40th
WI 2,580 $113,830 26th
U.S. 125,280 $116,080 -------

(*) annual mean wage ranking among the 50 states and the District of Columbia

Source: U.S. Bureau of Labor Statistics OES. Data extracted on April 24, 2021

Wednesday, September 22, 2021

Heart Disease Deaths in the Southeastern U.S.

Heart disease is the foremost cause of death in the U.S., accounting for more than 659,000 deaths in 2019, or approximately 23% of all deaths in the United States that year.  Despite its top position, the nation's heart disease death rate has dropped since the late 1990s thanks to advancements in medical knowledge and technology. From its 1999 level of 259.9 deaths per 100,000 population, the heart disease death rate had dropped to 200.8 deaths per 100,000 population by 2019, a decline of nearly 23%.  The twelve-state Southeastern U.S. saw its heart disease death rate drop about 22% in the twenty years from 1999, a slightly smaller improvement than the country as a whole. In both 1999 and 2019, the region's heart disease death rate was slightly worse than the national average.  A deeper look into data from the National Center for Health Statistics, a unit of the CDC, reveals the following about the trend in heart disease deaths in the Southeastern U.S. region:

Heart Disease Deaths in the Southeastern U.S.

Area/Deaths 1999 2009 2019
AL 13,419 12,021 13,448
AR 8,315 7,295 8,669
FL 51,434 41,274 47,144
GA 17,597 16,165 19,543
KY 12,098 9,728 10,742
LA 12,007 10,169 11,302
MS 9,336 7,530 7,997
NC 19,191 17,203 19,617
SC 9,981 9,068 10,579
TN 16,280 14,257 16,814
VA 15,329 13,397 15,062
WV 6,822 5,038 5,087
Region 191,809 163,145 186,004
U.S. 725,192 599,413 659,041
Area/Death Rate* 1999 2009 2019
AL 302.9 252.7 274.3
AR 313.6 251.8 287.3
FL 326.4 221.3 219.5
GA 218.7 168.0 184.1
KY 301.1 225.3 240.4
LA 269.2 226.4 243.1
MS 330.1 254.5 268.7
NC 241.4 182.1 187.0
SC 251.1 197.6 205.5
TN 288.7 226.1 246.2
VA 219.0 169.0 176.5
WV 376.5 272.7 283.8
Region 279.7 209.7 219.1
U.S. 259.9 195.4 200.8

(*) number of heart disease deaths per 100,000 population

Source: CDC Wonder. Centers for Disease Control and Prevention, National Center for Health Statistics. Underlying Cause of Death 1999-2019 on CDC WONDER Online Database, released in 2020. Data are from the Multiple Cause of Death Files, 1999-2019, as compiled from data provided by the 57 vital statistics jurisdictions through the Vital Statistics Cooperative Program. Accessed on June 9, 2021

Tuesday, September 21, 2021

Chiropractor Pay in the Great Plains Region

According to May 2020 data made public earlier this year by the U.S. Bureau of Labor Statistics (BLS),  there were over 34,700 chiropractors working in the United States.  As of that time, the seven-state Great Plains region of the country was home to almost 4,500 employed chiropractors.  For chiropractors, pay levels in the region varied widely from state-to-state, as evidenced by a closer examination of May 2020 BLS data, which revealed the following about chiropractor pay in the Great Plains region of the U.S.:

Chiropractor Pay in the Great Plains Region

State # Employed Annual Mean Wages Wage Rank*
IA 790 $64,350 44th
KS 510 $56,850 48th
MN 1,370 $93,540 13th
MO 800 $106,870 2nd
NE 530 $72,010 37th
ND 260 $84,690 23rd
SD 190 $83,660 24th
U.S. 34,760 $83,830 -------

(*) annual mean wage ranking among the 50 states

Source: U.S. Bureau of Labor Statistics OES. Data extracted on April 21, 2021

Monday, September 20, 2021

Health Services Management Pay in the U.S. Mid-East Region

There were more than 402,000 health service management jobs in the U.S. as of May 2020 according to data published recently by the U.S. Bureau of Labor Statistics (BLS).  As of May 2020, nearly 66,000 were employed as health services managers in the U.S. Mid-East region, an area that encompasses five states and the District of Columbia.  On a relative basis, health service management jobs in the U.S. Mid-East region paid better than in any other region of the country, as the District of Columbia and three states in the region ranked among the top 10 states in the nation for health service manager annual mean wage levels. According to May 2020 BLS data, health services management pay in the U.S. Mid-East region looked as follows:

Health Services Management Pay in the U.S. Mid-East Region

Health Services Management Pay in the U.S. Mid-East Region

State # Employed Annual Mean Wages Wage Rank*
DC 1,590 $157,590 1st
DE 1,020 $130,300 10th
MD 10,450 $132,090 7th
NJ 12,310 $127,380 13th
NY 24,360 $156,140 2nd
PA 16,260 $107,710 33rd
U.S. 402,540 $118,800 -------

(*) annual mean wage ranking among the 50 states and the District of Columbia

Source: U.S. Bureau of Labor Statistics OES. Data extracted on April 21, 2021

Friday, September 17, 2021

Surgical Technologist Pay in New England

May 2020 data published recently by the U.S. Bureau of Labor Statistics (BLS) revealed that over 107,000 surgical technologists were employed in the United States. With just over 4,600 surgical technologists employed, the six-state New England region accounted for about 4.3% of U.S. surgical technologist employment. New England is one of the best regions in the country for surgical technologist pay, with two states in the region ranked among the ten best states in the nation for surgical technologist annual mean wages. From May 2020 BLS data, here is a closer look at surgical technologist pay in New England:

Surgical Technologist Pay in New England

Surgical Technologist Pay in New England

State # Employed Annual Mean Wages Wage Rank*
CT 1,030 $62,310 4th
MA 2,410 $59,330 11th
ME 500 $50,010 24th
NH 430 $51,800 20th
RI 190 $59,410 9th
VT 70 $47,750 33rd
U.S. 107,400 $51,510 -------

(*) annual mean wage ranking among the 50 states and the District of Columbia

Source: U.S. Bureau of Labor Statistics OES. Data extracted on June 7, 2021

Thursday, September 16, 2021

Massage Therapist Pay in the Rocky Mountain Region

Data released earlier this year by the U.S. Bureau of Labor Statistics (BLS) indicated that, as of May 2020, there were over 85,000 massage therapists employed in the United States.  The five-state Rocky Mountain region accounted for a bit more than 7,000 of those massage therapist jobs.  A deeper look look at the BLS data from May 2020 revealed the following about massage therapist pay in the Rocky Mountain region:

Massage Therapist Pay in the Rocky Mountain Region

Massage Therapist Pay in the Rocky Mountain Region


State # Employed Annual Mean Wages Wage Rank*
CO 5,240 $46,020 26th
ID 350 $49,820 15th
MT 210 $42,490 35th
UT 1,290 $46,730 21st
WY 80 $50,990 12th
U.S. 85,040 $47,350 -------

(*) annual mean wage ranking among the 50 states and the District of Columbia

Source: U.S. Bureau of Labor Statistics OES. Data extracted on June 5, 2021

Wednesday, September 15, 2021

Firearm Deaths in the Great Lakes Region

In 2019 there were over 39,700 deaths caused by firearm incidents in the United States. That put the 2019 firearms death rate at about 12.1 deaths per 100,000 population.  By comparison, twenty years earlier, in 1999, the national firearms death rate was about 15% lower at 10.3 deaths per 100,000 population.  While the national firearms death rate surged between 1999 and 2019, in the Great Lakes region the increase in the death rate was more severe.  From a region where the firearms death rate was nearly 6% below the national average in 1999, by 2019 the Great Lakes region had a firearms death rate that was on par with the national average.  The surge in the firearms death rate from 1999 to 2019 was particularly severe in Ohio.  A closer examination of data from the National Center for Health Statistics, a unit of the CDC, reveals the following about firearm deaths in the Great Lakes region:

Firearm Deaths in the Great Lakes Region

Firearm Deaths in the Great Lakes Region

State/Deaths 1999 2009 2019
IL 1,209 1,058 1,367
IN 680 735 958
MI 1,085 1,095 1,220
OH 939 991 1,578
WI 448 457 604
Region 4,361 4,3365,727
U.S. 28,874 31,347 39,707
State/Death Rate* 1999 2009 2019
IL 9.8 8.3 10.8
IN 11.2 11.4 14.2
MI 11.0 11.1 12.2
OH 8.3 8.6 13.5
WI 8.4 8.1 10.4
Region 9.79.4 12.2
U.S. 10.3 10.2 12.1

(*) number of firearm-caused deaths per 100,000 population

Source: CDC Wonder. Centers for Disease Control and Prevention, National Center for Health Statistics. Underlying Cause of Death 1999-2019 on CDC WONDER Online Database, released in 2020. Data are from the Multiple Cause of Death Files, 1999-2019, as compiled from data provided by the 57 vital statistics jurisdictions through the Vital Statistics Cooperative Program. Accessed on June 2, 2021

Tuesday, September 14, 2021

Speech Language Pathologist Pay in the Southeastern U.S.

The U.S. Bureau of Labor Statistics (BLS) published reports earlier this year indicating that almost 148,500 speech language pathologists (SLPs) were employed in the United States as of May 2020.  More than 33,000 of those employed in the U.S. as SLPs resided in the twelve-state Southeastern region of the country.  The Southeast region is one of the weakest regions in the country for speech language pathologist pay.  Outside of Virginia, which had the 6th best SLP annual mean wage level in the nation, all states in the region registered SLP annual mean wage levels below the national average.  This included four Southeastern states that ranked among the ten worst states in the country for SLP annual mean wages.  A closer look at BLS data from May 2020 reveals the following about speech language pathologist pay in the Southeastern U.S.:

Speech Language Pathologist Pay in the Southeastern U.S.

State # Employed Annual Mean Wages Wage Rank*
AL 1,640 $66,400 50th
AR 1,940 $73,630 40th
FL 8,370 $81,000 20th
GA 3,430 $78,140 29th
KY 2,310 $74,520 39th
LA 1,160 $81,780 17th
MS 1,310 $67,250 48th
NC 4,610 $73,400 41st
SC 1,660 $71,340 45th
TN 3,150 $75,430 35th
VA 2,940 $92,520 6th
WV 800 $67,010 49th
U.S. 148,450 $83,240 -------

(*) annual mean wage ranking among the 50 states and the District of Columbia

Source: U.S. Bureau of Labor Statistics OES. Data extracted on June 2, 2021

Monday, September 13, 2021

Recreational Therapist Pay in the Southwestern U.S.

The U.S. Bureau of Labor Statistics (BLS) recently released data that put recreational therapist employment in the United States at more than 20,000 as of May 2020.  About 2,100 recreational therapists worked in the four-state Southwestern region according to BLS data.  Relative to the rest of the nation, BLS data shows the region to be a poor one for recreational therapist pay, with all states in the region registering an annual mean wage for recreational therapists below the national average.  A closer examination of May 2020 BLS data reveals the following about recreational therapist pay in the Southwestern U.S.:

Recreational Therapist Pay in the Southwestern U.S.

Recreational Therapist Pay in the Southwestern U.S.


State # Employed Annual Mean Wages Wage Rank*
AZ 310 $48,300 27th
NM 120 $40,100 44th
OK 170 $40,700 43rd
TX 1,520 $42,980 42nd
U.S. 20,080 $51,260 -------

(*) annual mean wage ranking among the 50 states and the District of Columbia

Source: U.S. Bureau of Labor Statistics OES. Data extracted on May 29, 2021

Sunday, September 12, 2021

Drug Induced Deaths in the Rocky Mountain Region

U.S. drug induced deaths totaled over 74,500 in 2019, or about 22.7 deaths per 100,000 population.  Drug overdoses, both accidental and intentional, accounted for almost 95% of these fatalities.  In the twenty years from 1999, the number of drug induced deaths in the U.S. per 100,000 population more than tripled.  While all regions of the country witnessed sharp increases in drug induced deaths in the twenty years from 1999 to 2019, the experience in the five-state Rocky Mountain region was less severe.  Even so, the region's drug induced death rate more than doubled, from 7.9 deaths per 100,000 population in 1999 to 18.1 deaths per 100,000 population in 2019.   A review of data from the CDC's National Center for Health Statistics reveals the following about drug induced deaths in the Rocky Mountain region.:

Drug Induced Deaths in the Rocky Mountain Region

Drug Induced Deaths in the Rocky Mountain Region


Area/Deaths 1999 2009 2019
CO 375 784 1,118
ID 66 181 280
MT 48 147 153
UT 212 508 614
WY 21 63 81
Region 722 1,683 2,246
U.S. 19,128 39,147 74,511
Area/Death Rate* 1999 2009 2019
CO 8.9 15.8 19.4
ID 5.2 11.6 15.7
MT 5.3 14.9 14.3
UT 9.6 18.7 19.2
WY 4.3 11.3 14.0
Region 7.9 15.6 18.1
U.S. 6.9 12.8 22.7

(*) number of drug induced deaths per 100,000 population

Source: CDC Wonder. Centers for Disease Control and Prevention, National Center for Health Statistics. Underlying Cause of Death 1999-2019 on CDC WONDER Online Database, released in 2020. Data are from the Multiple Cause of Death Files, 1999-2019, as compiled from data provided by the 57 vital statistics jurisdictions through the Vital Statistics Cooperative Program. Accessed on June 5, 2021

Friday, September 10, 2021

Physical Therapy Assistant Pay in the U.S. Far West

May 2020 data recently published by the U.S. Bureau of Labor Statistics (BLS) reported that almost 93,000 physical therapy (PT) assistants were employed in the U.S. at that time.  Approximately 9,000 physical therapy assistants were employed in the six-state Far West region of the U.S. as of May 2020. BLS data shows the Far West to be a relatively strong region for physical therapy assistant pay.  Although three states in the region had average annual mean wage levels for PT assistants that were below the national average, over 90% of the region's PT assistants lived in a state where the annual mean wage exceeded the national average.  This included California, the #1 state in the country in terms of PT assistant annual mean wages.  BLS data from May 2020 reveals the following about physical therapy assistant pay in the U.S. Far West:

Physical Therapy Assistant pay in the U.S. Far West

Physical Therapy Assistant Pay in the U.S. Far West

State # Employed Annual Mean Wages Wage Rank*
AK 120 $59,230 18th
CA 5,860 $70,570 1st
HI 160 $57,560 25th
NV 500 $59,160 19th
OR 810 $61,370 11th
WA 1,630 $61,850 9th
U.S. 92,740 $59,440 -------

(*) annual mean wage ranking among the 50 states and the District of Columbia

Source: U.S. Bureau of Labor Statistics OES. Data extracted on May 29, 2021