Tuesday, August 31, 2021

Nurse Practitioner Pay in the U.S. Southeast

Earlier this summer the U.S. Bureau of Labor Statistics (BLS) reported that more than 211,000 nurse practitioners (NPs) were employed in the United States as of May 2020.  The twelve-state U.S. Southeast accounted for 63,000 NP jobs in May 2020.  The U.S. Southeast region is the weakest in the nation for nurse practitioner pay.  The average NP annual mean wage in every state in the region is below the national average, and the region is home to seven of the ten worst states in the nation for nurse practitioner annual mean wages.  A further examination of BLS data from May 2020 shows the following about nurse practitioner pay in the U.S. Southeast:

Nurse Practitioner Pay in the U.S. Southeast

State # Employed Annual Mean Wages Wage Rank*
AL 3,930 $99,790 50th
AR 2,730 $106,210 42nd
FL 13,010 $101,060 49th
GA 8,120 $106,220 41st
KY 4,250 $102,460 47th
LA 3,170 $111,880 26th
MS 3,640 $109,550 34th
NC 6,040 $108,370 36th
SC 2,820 $101,190 48th
TN 8,300 $99,370 51st
VA 5,790 $109,660 33rd
WV 1,200 $105,220 44th
U.S. 211,280 $114,510 -------

(*) annual mean wage ranking among the 50 states and the District of Columbia

Source: U.S. Bureau of Labor Statistics OES. Data extracted on May 17, 2021

Monday, August 30, 2021

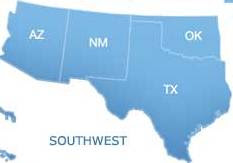
Dental Hygienist Pay in the Southwestern U.S.

Data published earlier this year by the U.S. Bureau of Labor Statistics (BLS) put dental hygienist (DH) employment in the USA at about 195,000 as of May 2020.  At that time, approximately 20,700 dental hygienists were working in the four-state Southwestern U.S. according to the BLS.  The region is an average one for dental hygienist pay.  Although Arizona DHs earn an average annual mean wage that topped the national average by 7%, the vast majority of dental hygienists in the region lived in states where DH annual mean wages were slightly below the national average.  A deeper look at May 2020 BLS data details the following about dental hygienist pay in the Southwestern U.S.:

Dental Hygienist Pay in the Southwestern U.S.

Dental Hygienist Pay in the Southwestern U.S.


State # Employed Annual Mean Wages Wage Rank*
AZ 3,660 $83,860 14th
NM 1,090 $78,410 17th
OK 2,730 $76,710 21st
TX 13,230 $77,590 18th
U.S. 194,830 $78,050 -------

(*) annual mean wage ranking among the 50 states and the District of Columbia

Source: U.S. Bureau of Labor Statistics OES. Data extracted on May 17, 2021

Saturday, August 28, 2021

Heart Disease Deaths in the Great Plains Region

Heart disease is the top cause of death in the United States, accounting for more than 659,000 deaths in 2019, or approximately 23% of all deaths in the USA that year.  Advancements in medical know-how have materially lowered the heart disease death rate over the past twenty years. From a 1999 level of 259.9 deaths per 100,000 population, by 2019 the heart disease death rate had declined to 200.8 deaths per 100,000 population, a drop of more than 22%.  The seven-state Great Plains region saw its heart disease death rate drop about 24% in the twenty years from 1999, a slightly better experience than the nation as a whole. On the whole, the region's 2019 heart disease death rate was slightly worse than the national average, due in large part to particularly high death rates in Iowa and Missouri.  A deeper examination of data from the CDC's National Center for Health Statistics reveals the following about the trend in heart disease deaths in the Great Plains region:

Heart Disease Deaths in the Great Plains Region

Area/Deaths 1999 2009 2019
IA 8,699 6,938 7,505
KS 6,975 5,294 6,140
MN 9,533 7,238 8,401
MO 17,974 13,916 15,018
NE 4,497 3,277 3,540
ND 1,833 1,431 1,448
SD 2,024 1,778 1,840
Region 51,535 39,872 43,892
U.S. 725,192 599,413 659,041
Area/Death Rate* 1999 2009 2019
IA 298.2 228.8 237.9
KS 260.4 186.9 210.8
MN 195.6 137.1 149.0
MO 323.2 233.4 244.7
NE 263.8 180.8 183.0
ND 284.5 215.2 190.0
SD 269.7 220.3 208.0
Region 269.4 195.5 204.8
U.S. 259.9 195.4 200.8

(*) number of heart disease deaths per 100,000 population

Source: CDC Wonder. Centers for Disease Control and Prevention, National Center for Health Statistics. Underlying Cause of Death 1999-2019 on CDC WONDER Online Database, released in 2020. Data are from the Multiple Cause of Death Files, 1999-2019, as compiled from data provided by the 57 vital statistics jurisdictions through the Vital Statistics Cooperative Program. Accessed on June 9, 2021

Thursday, August 26, 2021

National Institute of Mental Health, Our Trusted Link for August 2021


https://www.nimh.nih.gov/

National Institute of Mental Health

The National Institute of Mental Health (NIMH) is the lead federal agency for research on mental disorders. Its mission is to transform the understanding and treatment of mental illnesses through basic and clinical research, paving the way for prevention, recovery, and cure. Their goals include

  • defining the brain mechanisms underlying behavior
  • examining the course of mental illness in lives (example)
  • working to prevent and cure mental illness
  • improving public health. 

Their major programs include

Headquartered in Bethesda, Maryland, the original agency was chartered in 1946 by President Harry Truman. Since 1992, it has been part of the National Institutes of Health.  Its 2020 budget was $1.63 billion, with over 500 employees. 

Hundreds of free brochures, guides, reports and fact sheets, some in Spanish as well as English, are available. Some are written for consumers, some for health professionals. Many are available in either printed or PDF format. Shipping charges are applied. 

In addition to multimedia presentations and videos, NIMH provides online viewing of the Director's Innovation Speaker Series, a series of lectures dedicated to innovation, invention, and scientific discovery

Free email subscriptions available

  • NIMH News (general announcements)
  • Inside NIMH email newsletter on funding awards
  • Funding Opportunity Announcements
  • Discover NIMH emails on raising mental health awareness
Mental Health Topic Finder

Wednesday, August 25, 2021

Medical Assistant Pay in the Great Lakes Region

U.S. Bureau of Labor Statistics (BLS) data released earlier this year put medical assistant (MA) employment in the U.S. at over 710,000 as of May 2020. Per BLS data, approximately 101,000 medical assistants were employed in the five-state Great Lakes region. In general, the region is a subpar one for medical assistant pay based on BLS data.  Although the average annual mean wage for medical assistants in Illinois and Wisconsin were above the national average, 65% of the region's MAs lived in states where the MA annual mean wage was more than 5% below the national average.  A closer examination of BLS data reveals the following about medical assistant pay in the Great Lakes region as of May 2020:

Medical Assistant Pay in the Great Lakes Region

Medical Assistant Pay in the Great Lakes Region

State # Employed Annual Mean Wages Wage Rank*
IL 22,030 $37,190 20th
IN 16,790 $34,790 32nd
MI 22,750 $34,830 30th
OH 26,250 $34,270 36th
WI 13,250 $38,800 13th
U.S. 710,200 $36,930 -------

(*) annual mean wage ranking among the 50 states and the District of Columbia

Source: U.S. Bureau of Labor Statistics OES. Data extracted on May 15, 2021

Monday, August 23, 2021

Family Physician Pay in the Great Plains Region

Recently published information by the U.S. Bureau of Labor Statistics (BLS) put family medicine physician employment at more than 98,000 as of May 2020.  More than 13,000 of those employed as family physicians lived in the seven-state Great Plains region of the country.  BLS data reveals the region to be a good one for family physician pay, except in Missouri, which ranks in the bottom quintile nationally for family physician annual mean wages.  The other six states in the region all feature family physician annual mean wage levels above the national average and one of those states, Minnesota, ranks as one of the ten best states in the nation for family physician annual mean wages.  Further examination of May 2020 data from the BLS tells us the following about family medicine physician pay in the Great Plains region:

Family Physician Pay in the Great Plains Region

State # Employed Annual Mean Wages Wage Rank*
IA 1,320 $226,510 14th
KS 520 $228,590 12th
MN 2,450 $248,630 5th
MO 7,520 $194,120 45th
NE 700 $219,000 22nd
ND 320 $220,280 20th
SD 340 $224,960 15th
U.S. 98,590 $214,370 -------

(*) annual mean wage ranking among the 50 states and the District of Columbia

Source: U.S. Bureau of Labor Statistics OES. Data extracted on May 12, 2021

Sunday, August 22, 2021

Drug Induced Deaths in the Southwestern U.S.

In 2019 the United States recorded over 74,500 drug induced deaths, a nearly four-fold increase in the number of such deaths since 1999. The 2019 U.S. drug induced death rate of 22.7 deaths per 100,000 population contrasted to just 6.9 such deaths per 100,000 population twenty years earlier.  Drug overdoses, both intentional and accidental, accounted for nearly 95% of these deaths.  While all regions of the country experienced increases in the number of drug induced deaths in the twenty year period from 1999, the experience in the four-state Southwestern U.S. was less severe.  While the national drug induced death rate more than tripled from 1999 to 2019, during this same period the drug induced death rate in the Southwest slightly more than doubled.  A closer look at data from the Centers for Disease Control and Prevention, National Center for Health Statistics, reveals the following about drug induced deaths in the Southwestern U.S.:

Drug Induced Deaths in the Southwestern U.S.

Drug Induced Deaths in the Southwestern U.S.


Area/Deaths 1999 2009 2019
AZ 557 1,041 2,016
NM 275 447 632
OK 189 766 680
TX 1,250 2,509 3,355
Region 2,271 4,763 6,683
U.S. 19,128 39,147 74,511
Area/Death Rate* 1999 2009 2019
AZ 11.1 16.4 27.7
NM 15.2 21.9 30.1
OK 5.5 20.6 17.2
TX 6.1 10.1 11.6
Region 7.4 12.9 15.8
U.S. 6.9 12.8 22.7

(*) number of drug induced deaths per 100,000 population

Source: CDC Wonder. Centers for Disease Control and Prevention, National Center for Health Statistics. Underlying Cause of Death 1999-2019 on CDC WONDER Online Database, released in 2020. Data are from the Multiple Cause of Death Files, 1999-2019, as compiled from data provided by the 57 vital statistics jurisdictions through the Vital Statistics Cooperative Program. Accessed on June 5, 2021

Friday, August 20, 2021

General Dentist Pay in the Mid-East U.S. Region

There were almost 96,000 general dentists at work in the U.S. as of May 2020 according to recently published information by the U.S. Bureau of Labor Statistics (BLS).  Just over 14,000 general dentists were employed in the Mid-East section of the country, a region that spans five states and the District of Columbia.  For general dentists, on the whole the region was a subpar one in terms of pay, as more than 80% of the region's dentists lived in states where the general dentist annual mean wage was below the national average.  A more detailed examination of May 2020 BLS data reveals the following about general dentist pay in the Mid-East U.S. region:

General Dentist Pay in the Mid-East U.S. Region

General Dentist Pay in the Mid-East U.S. Region

State # Employed Annual Mean Wages Wage Rank*
DC 500 N/A NR
DE 280 N/A NR
MD 1,800 $180,600 26th
NJ 2,390 $177,570 29th
NY 6,270 $170,350 35th
PA 3,030 $155,360 44th
U.S. 95,920 $180,830 -------

(*) annual mean wage ranking among the 50 states

Source: U.S. Bureau of Labor Statistics OES. Data extracted on May 12, 2021

Thursday, August 19, 2021

EMT and Paramedic Pay in New England

Data made available earlier this summer by the U.S. Bureau of Labor Statistics (BLS) detailed that over 257,000 EMTs (emergency medical technicians) and paramedics were employed in the United States as of May 2020. The six-state New England region accounted for a bit more than 14,000 of those EMT and paramedic jobs. In general, New England is a good one for EMT and paramedic pay.  Although EMTs and paramedics in Maine, New Hampshire and Vermont earn average annual mean wages below the national average, 75% of the region's EMTs and paramedics live in Massachusetts, Connecticut or Rhode Island, three states that ranked among the top 12 states nationally for EMT and paramedic annual mean wages. A deeper examination of May 2020 BLS data shows the following about EMT and paramedic pay in New England:

EMT and Paramedic Pay in New England

EMT and Paramedic Pay in New England

State # Employed Annual Mean Wages Wage Rank*
CT 3,830 $45,800 10th
MA 6,340 $46,110 9th
ME 1,450 $34,700 41st
NH 1,140 $38,830 21st
RI 670 $43,790 12th
VT 870 $36,580 34th
U.S. 257,700 $40,370 -------

(*) annual mean wage ranking among the 50 states and the District of Columbia

Source: U.S. Bureau of Labor Statistics OES. Data extracted on May 10, 2021

Saturday, August 14, 2021

Firearm Deaths in the Mid-Eastern U.S.

In 2019 there were over 39,700 firearm deaths in the United States. That equated to about 12.1 firearm deaths per 100,000 population.  In comparison to the national firearm death rate in 1999, by 2019 the number of firearms-caused deaths per 100,000 population had increased about 17%.  While the firearm death rate nationally surged over a 20-year span to 2019, the Mid-Eastern U.S. region saw its firearm death rate barely budge during the same period, from 7.5 to 7.6 deaths per 100,000 population.  With a firearm death rate that was 37% lower than the national average in 2019, the Mid-Eastern U.S. had the second lowest firearm death rate in the nation, second only to New England.  A closer look at data from the National Center for Health Statistics, a unit of the Centers for Disease Control and Prevention, reveals the following about firearm deaths in the Mid-Eastern U.S.:

Firearm Deaths in the Mid-Eastern U.S.

Firearm Deaths in the Mid-Eastern U.S.

State/Deaths 1999 2009 2019
DE 68 76 93
DC 163 111 141
MD 657 586 757
NJ 366 411 368
NY 1,016 958 804
PA 1,190 1,349 1,541
Region 3,460 3,491 3,704
U.S. 28,874 31,347 39,707
State/Death Rate* 1999 2009 2019
DE 8.8 8.5 9.6
DC 28.6 18.7 20.0
MD 12.5 10.2 12.5
NJ 4.4 4.7 4.1
NY 5.4 5.0 4.1
PA 9.7 10.6 12.0
Region 7.5 7.3 7.6
U.S. 10.3 10.2 12.1

(*) number of firearm-caused deaths per 100,000 population

Source: CDC Wonder. Centers for Disease Control and Prevention, National Center for Health Statistics. Underlying Cause of Death 1999-2019 on CDC WONDER Online Database, released in 2020. Data are from the Multiple Cause of Death Files, 1999-2019, as compiled from data provided by the 57 vital statistics jurisdictions through the Vital Statistics Cooperative Program. Accessed on June 2, 2021

Friday, August 13, 2021

The Top 5 Teaching Hospitals on the Great Plains in 2021

Only 175 hospitals in the United States attained a national rating in one or more of the 15 adult specialties studied in the most recent (21-22) U.S. News & World Report (USNWR) rankings of American hospitals.  Five Great Plains area teaching hospitals were among those hospitals that earned national recognition in at least two adult specialties.  The foremost teaching hospital in the region, Mayo Clinic, was deemed the best hospital in the nation by the USNWR study, while another Great Plains region teaching hospital, Barnes-Jewish Hospital, was rated a top 20 hospital nationally.  While the Great Plains region is home to multiple teaching hospitals, these five institutions earned the most recognition in the USNWR survey.


The Top 5 Teaching Hospitals on the Great Plains in 2021

Location:  Rochester, MN
Top 20 Overall Ranking Nationally:  Yes (1st)
Nationally Ranked Adult Specialties:  14 of 15
Adult Specialties Ranked in Top 20 Nationally:  14
#1 in Diabetes & Endocrinology
#1 in Gastroenterology & GI Surgery
#1 in Gynecology
#1 in Pulmonology & Lung Surgery
#1 in Urology
#2 in Cardiology & Heart Surgery
#2 in Orthopedics
#3 in Cancer
#3 in Geriatrics
#3 in Rheumatology
#4 in Ear, Nose and Throat
#6 in Neurology & Neurosurgery
#6 in Rehabilitation
#9 in Psychiatry

Location:  St. Louis
Top 20 Overall Ranking Nationally:  Yes (17th)
Nationally Ranked Adult Specialties:  11 of 15
Adult Specialties Ranked in Top 20 Nationally:  7
#7 in Diabetes & Endocrinology
#13 in Cancer
#14 in Gynecology
#17 in Neurology & Neurosurgery
#19 in Geriatrics
#20 in Ear, Nose and Throat
#20 in Gastroenterology & GI Surgery

University of Kansas Hospital
Location:  Kansas City, KS
Top 20 Overall Ranking Nationally:  No
Nationally Ranked Adult Specialties:  7 of 15
Adult Specialties Ranked in Top 20 Nationally:  1
#17 in Ear, Nose and Throat

University of Iowa Hospital
Location:  Iowa City
Top 20 Overall Ranking Nationally:  No
Nationally Ranked Adult Specialties:  4 of 15
Adult Specialties Ranked in Top 20 Nationally:  1
#7 in Ophthalmology

Abbott Northwestern Hospital
Location:  Minneapolis, MN
Top 20 Overall Ranking Nationally:  No
Nationally Ranked Adult Specialties:  2 of 15
Adult Specialties Ranked in Top 20 Nationally:  None

To find other teaching hospitals in the Plains Region and elsewhere, visit our U.S. Teaching Hospitals resource page.

Pharmacist Pay in the Southwestern U.S.

May 2020 data recently published by the U.S. Bureau of Labor Statistics (BLS) detailed that there were over 315,000 pharmacists working in the United States.  Nearly 36,800 of those employed as pharmacists in the U.S. worked in the four-state Southwestern region.  The U.S. Southwest is an average region in terms of pharmacist pay, as about two-thirds of pharmacists employed work in Texas or New Mexico, where pharmacist annual mean wages run at or near the national average.  BLS data from May 2020 reveals the following about pharmacist pay in the Southwestern U.S.:

Pharmacist Pay in the Southwestern U.S.

Pharmacist Pay in the Southwestern U.S.


State # Employed Annual Mean Wages Wage Rank*
AZ 8,180 $122,310 29th
NM 1,700 $126,930 14th
OK 3,760 $121,060 38th
TX 23,150 $125,470 16th
U.S. 315,470 $125,460 -------

(*) annual mean wage ranking among the 50 states and the District of Columbia

Source: U.S. Bureau of Labor Statistics OES. Data extracted on May 2, 2021

Wednesday, August 11, 2021

New England's Top Rated Teaching Hospitals in 2021

Only 175 hospitals in the U.S. earned national distinction in at least one of the 15 adult specialties examined in the most recent (21-22) U.S. News & World Report (USNWR) rankings of American hospitals.  Four New England teaching hospitals were among those hospitals that earned national recognition in at least one adult specialty.  The region's preeminent teaching hospital, Massachusetts General Hospital, is also a top 5 rated hospital in the country according to the USNWR study.  While the New England region is home to multiple teaching hospitals, these four institutions earned the most recognition in the USNWR survey.

New England's Top Rated Teaching Hospitals in 2021

New England's Top Rated Teaching Hospitals in 2021

Massachusetts General Hospital
Location:  Boston
Top 20 Overall Ranking Nationally:  Yes (5th)
Nationally Ranked Adult Specialties:  14 of 15
Adult Specialties Ranked in Top 20 Nationally:  13
#2 in Diabetes & Endocrinology
#2 in Ear, Nose & Throat
#3 in Psychiatry
#4 in Ophthalmology
#6 in Rheumatology
#7 in Cardiology & Heart Surgery
#8 in Orthopedics
#9 in Gynecology
#11 in Gastroenterology & GI Surgery
#12 in Neurology & Neurosurgery
#14 in Geriatrics
#16 in Pulmonology & Lung Surgery
#18 in Cancer

Brigham and Women's Hospital
Location:  Boston
Top 20 Overall Ranking Nationally:  Yes (14th)
Nationally Ranked Adult Specialties:  11 of 15
Adult Specialties Ranked in Top 20 Nationally:  9
#4 in Cancer
#4 in Gynecology
#5 in Rheumatology
#10 in Cardiology & Heart Surgery
#18 in Geriatrics
#18 in Neurology & Neurosurgery
#19 in Diabetes & Endocrinology
#19 in Ear, Nose & Throat
#19 in Urology

Yale-New Haven Hospital
Location:  New Haven, CT
Top 20 Overall Ranking Nationally:  No
Nationally Ranked Adult Specialties:  8 of 15
Adult Specialties Ranked in Top 20 Nationally:  1
#11 in Psychiatry

Beth Israel Deaconess Medical Center
Location:  Boston
Top 20 Overall Ranking Nationally:  No
Nationally Ranked Adult Specialties:  4 of 15
Adult Specialties Ranked in Top 20 Nationally:  None


To find teaching hospitals in other regions, visit our U.S. Teaching Hospitals resource page.

Monday, August 9, 2021

The Far West's Top 5 Teaching Hospitals in 2021

Extracted from the most recent U.S. News & World Report (USNWR) rankings of American hospitals, the Far West's top 5 teaching hospitals in 2021 include 4 of the top 20 hospitals in the country.  Only 175 hospitals earned national recognition in at least one of 15 adult specialties examined in the USNWR survey. The five teaching hospitals listed here earned national recognition in at least eleven adult specialties and a top 20 national ranking in at least six of those specialties.  While the Far West region of the U.S. is home to many more teaching hospitals, these five institutions earned the most distinction in the USNWR survey:

The Far West's Top 5 Teaching Hospitals in 2021

UCLA Medical Center
Location:  Los Angeles
Top 20 Overall Ranking Nationally:  Yes (3rd)
Nationally Ranked Adult Specialties:  14 of 15
Adult Specialties Ranked in Top 20 Nationally:  13
#3 in Diabetes & Endocrinology
#4 in Gastroenterology & GI Surgery
#4 in Geriatrics
#4 in Pulmonology & Lung Surgery
#5 in Ophthalmology
#5 in Orthopedics
#5 in Psychiatry
#8 in Cancer
#8 in Neurology & Neurosurgery
#8 in Urology
#9 in Cardiology & Heart Surgery
#9 in Rheumatology
#12 in Ear, Nose & Throat

Cedars-Sinai Medical Center
Location:  Los Angeles
Top 20 Overall Ranking Nationally:  Yes (6th)
Nationally Ranked Adult Specialties:  11 of 15
Adult Specialties Ranked in Top 20 Nationally:  10
#2 in Gastroenterology & GI Surgery
#3 in Cardiology & Heart Surgery
#3 in Orthopedics 
#3 in Pulmonology & Lung Surgery
#7 in Urology
#9 in Cancer
#10 in Geriatrics
#11 in Neurology & Neurosurgery
#12 in Gynecology
#18 in Ear, Nose & Throat

UCSF Medical Center
Location:  San Francisco
Top 20 Overall Ranking Nationally:  Yes (9th)
Nationally Ranked Adult Specialties:  14 of 15
Adult Specialties Ranked in Top 20 Nationally:  11
#1 in Neurology & Neurosurgery
#5 in Ear, Nose & Throat
#6 in Diabetes & Endocrinology
#6 in Psychiatry
#7 in Rheumatology
#9 in Geriatrics
#9 in Ophthalmology
#11 in Pulmonology & Lung Surgery
#11 in Cancer
#12 in Urology
#16 in Orthopedics

Stanford Hospital
Location:  Stanford, CA
Top 20 Overall Ranking Nationally:  Yes (12th)
Nationally Ranked Adult Specialties:  11 of 15
Adult Specialties Ranked in Top 20 Nationally:  9
#8 in Cardiology & Heart Surgery
#9 in Gynecology
#12 in Cancer
#12 in Pulmonology & Lung Surgery
#13 in Ear, Nose & Throat
#13 in Neurology & Neurosurgery
#13 in Orthopedics
#15 in Geriatrics
#20 in Urology

Keck Hospital of USC
Location:  Los Angeles
Top 20 Overall Ranking Nationally:  No
Nationally Ranked Adult Specialties:  12 of 17
Adult Specialties Ranked in Top 20 Nationally:  6
#10 in Urology
#11 in Geriatrics
#12 in Gastroenterology & GI Surgery
#13 in Ophthalmology
#14 in Cardiology & Heart Surgery
#20 in Cancer

To find other teaching hospitals in the Far West and elsewhere, visit our U.S. Teaching Hospitals resource page.

Cancer Deaths in the Rocky Mountain Region

Cancer is the number two cause of death in USA, accounting for more than 599,000 deaths in 2019, or about 21% of all deaths in the United States that year.  Thanks to improvements in medical science, the death rate from cancer dropped modestly from 1999 to 2019. In 1999 the U.S. experienced 197.0 cancer deaths per 100,000 population, but by 2019 the cancer death rate had dropped 7.3%, to 182.7 deaths per 100,000 population.  The favorable national trend in cancer deaths was also seen in the five-state Rocky Mountain region, although the improvement was more modest, with the region's death rate declining only 3.5% between 1999 and 2019.  That said, the Rocky Mountain region had the lowest cancer death rate of any region of the U.S. in both 1999 and 2019.  The region's 2019 cancer death rate of 139.7 deaths per 100,000 population was more than 23% lower than the national average.  A deeper look at data from the Centers for Disease Control and Prevention, National Center for Health Statistics, reveals the following about cancer deaths in the Rocky Mountain region:

Cancer Deaths in the Rocky Mountain Region

Cancer Deaths in the Rocky Mountain Region


Area/Deaths 1999 2009 2019
CO 5,863 6,950 7,986
ID 2,162 2,458 2,928
MT 1,854 1,914 2,099
UT 2,393 2,555 3,289
WY 899 936 1,016
Region 13,171 14,813 17,318
U.S. 549,838 567,628 599,601
Area/Death Rate* 1999 2009 2019
CO 138.7 139.8 138.7
ID 169.5 158.1 163.8
MT 206.6 194.5 196.4
UT 108.6 93.8 102.6
WY 182.8 167.2 175.5
Region 144.8 137.2 139.7
U.S. 197.0 185.0 182.7

(*) number of cancer deaths per 100,000 population

Source: CDC Wonder. Centers for Disease Control and Prevention, National Center for Health Statistics. Underlying Cause of Death 1999-2019 on CDC WONDER Online Database, released in 2020. Data are from the Multiple Cause of Death Files, 1999-2019, as compiled from data provided by the 57 vital statistics jurisdictions through the Vital Statistics Cooperative Program. Accessed on July 17, 2021