Monday, December 11, 2023

Physical Therapist Pay in the U.S. Southwest

Data released recently from the U.S. Bureau of Labor Statistics (BLS) reports that there were more than 229,700 physical therapists (PTs) at work in the United States as of May 2022.  Nearly 24,000 of those working as physical therapists in the U.S. lived in the four-state Southwest region.  The Southwest region was a relatively good one for physical therapist pay, with the two largest states in the region, Arizona and Texas, both recording PT annual mean wage levels that ranked among the top 10 states nationally for the profession.  A deeper dive into BLS data from May 2022 reveals the following about PT employment and physical therapist pay in the U.S. Southwest:
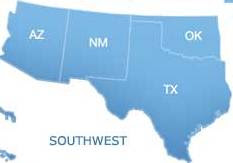
Physical Therapist Pay in the U.S. Southwest

Physical Therapist Pay in the U.S. Southwest


State # Employed Annual Mean Wages Wage Rank*
AZ 4,280 $99,980 10th
NM 1,310 $92,050 31st
OK 2,080 $91,100 38th
TX 16,280 $102,300 7th
U.S. 229,740 $97,960 -------

(*) annual mean wage ranking among the 50 states and the District of Columbia

Source: U.S. Bureau of Labor Statistics OES. Data extracted on December 10, 2023

Sunday, December 10, 2023

Pharmacist Pay in the Great Lakes Region

According to the latest data published by the U.S. Bureau of Labor Statistics (BLS), as of May 2022, there were nearly 325,500 pharmacists employed in the United States.  About 48,000 of those employed as pharmacists in the U.S. lived in the five-state Great Lakes region.  Generally speaking, the region is a modestly weak one for pharmacist pay.  Although Wisconsin ranked among the ten best states in the U.S. for pharmacist annual mean wage levels, that pay metric was below the national average in every other state in the region.  BLS data from May 2022 details the following about pharmacist employment and pharmacist pay in the Great Lakes region:

Pharmacist Pay in the Great Lakes Region


Pharmacist Pay in the Great Lakes Region

State # Employed Annual Mean Wages Wage Rank*
IL 12,560 $125,130 35th
IN 6,710 $124,760 36th
MI 10,200 $124,390 37th
OH 13,170 $121,290 45th
WI 5,450 $132,530 8th
U.S. 325,480 $129,410 -------

(*) annual mean wage ranking among the 50 states and the District of Columbia

Source: U.S. Bureau of Labor Statistics OES. Data extracted on December 10, 2023

Wednesday, December 6, 2023

Licensed Practical Nurse Pay in the Southeast

May 2022 employment data published this year by the U.S. Bureau of Labor Statistics (BLS) revealed that there were about 632,000 licensed practical nurses (LPNs) at work in the United States.  Known as licensed vocational nurses (LVNs) in certain parts of the country, LPNs comprise one of the largest healthcare occupations in the U.S.  Nearly 190,000 licensed practical nurses were employed in the twelve-state Southeastern region of the country. Home to 30% of all LPNs nationally, the Southeast is easily the worst region in the country for LPN pay as licensed practical nurse annual mean wage levels in all twelve states in the region fell below the national average.  Moreover, seven Southeastern states ranked among the ten states nationally with the lowest LPN annual mean wages.  A closer examination of BLS data from May 2022 reveals the following about licensed practical nurse pay in the Southeast region of the U.S.:

Licensed Practical Nurse Pay in the Southeast

Licensed Practical Nurse Pay in the Southeast

State # Employed Annual Mean Wages Wage Rank*
AL 10,290 $45,260 50th
AR 10,790 $45,990 48th
FL 36,970 $53,780 29th
GA 22,900 $50,830 41st
KY 10,370 $49,570 42nd
LA 19,230 $47,430 45th
MS 8,660 $45,020 51st
NC 16,230 $53,010 31st
SC 9,080 $51,060 40th
TN 20,480 $46,540 46th
VA 18,490 $52,790 33rd
WV 6,200 $45,530 49th
U.S. 632,020 $55,860 -------

(*) annual mean wage ranking among the 50 states and the District of Columbia

Source: U.S. Bureau of Labor Statistics OES. Data extracted on December 2, 2023

Tuesday, December 5, 2023

New England's Top Cancer Hospitals

In the 23-24 U.S. News & World Report ratings of American hospitals, nearly 900 hospitals were examined for their proficiency and effectiveness in delivering cancer care to adult patients.  The study rated hospitals on various measures related to their cancer patient outcomes, the scale of their cancer care services and programs, and the level of professional recognition a hospital earned from their peers within the cancer care community.  Four New England hospitals rated among the top 50 U.S. hospitals for adult cancer care in the 23-24 survey.  Here's a quick view of these four New England institutions and where they rated nationally for adult cancer care in the 23-24 U.S. News survey:


New England's Top Cancer Hospitals


New England's Top Cancer Hospitals

Dana Farber Brigham Cancer Center
Location:  Boston
National Rank:  #5 (See ranking details)

Beth Israel Deaconess Medical Center
Location:  Boston
National Rank:  #17 (See ranking details)

Massachusetts General Hospital
Location:  Boston
National Rank:  #28 (See ranking details)

Smilow Cancer Hospital at Yale New Haven
Location:  New Haven, CT
National Rank:  #50 (See ranking details)

To further examine the metrics used to grade adult cancer care hospitals in the 23-24 U.S. News survey, or to find cancer care ratings for other New England hospitals, visit Best Hospitals for Adult Cancer Care.

Monday, December 4, 2023

Occupational Therapist Employment in the Mid-East Region

Recently published May 2022 employment data from the U.S. Bureau of Labor Statistics (BLS) reported that there were nearly 135,000 occupational therapists (OTs) employed in the U.S.  About 24,000 of those OT jobs were in the Mid-East region of the country, an area that encompasses five states and the District of Columbia.  BLS data reveals the Mid-East region to be a mixed one in terms of OT pay, with OT annual mean wage levels in several states falling below the national average for all occupational therapists.  Even so, the District of Columbia and New Jersey were in the top ten nationally for OT annual mean wages.  BLS data reveals the following about occupational therapist employment in the Mid-East region of the U.S. as of May 2022:

Occupational Therapist Employment in the Mid-East Region

Occupational Therapist Employment in the Mid-East Region

State # Employed Annual Mean Wages Wage Rank*
DC 410 $96,000 10th
DE 420 $88,180 29th
MD 2,900 $95,810 11th
NJ 4,280 $104,710 3rd
NY 8,660 $95,280 13th
PA 7,290 $88,560 28th
U.S. 134,980 $92,800 -------

(*) annual mean wage ranking among the 50 states and the District of Columbia

Source: U.S. Bureau of Labor Statistics OES. Data extracted on December 2, 2023

Saturday, December 2, 2023

Dental Assistant Pay in the Great Plains Region

Data released recently from the U.S. Bureau of Labor Statistics (BLS) reported that, as of May 2022, more than 363,000 dental assistants were working in the United States.  About 23,000 dental assistants at work in May 2022 lived in the seven-state Great Plains region of the country.  BLS data reveals much disparity in the Great Plains region for dental assistant pay.  Dental assistants in Minnesota enjoy the highest average annual mean wage in the country, and North Dakota is another top 10 state for dental assistant annual mean wages.  However, about 53% of the region's dental assistants work in one of three states that rank 30th or worse for average annual mean wages for the profession.  A deeper dive into May 2022 BLS data details the following about dental assistant pay in the Great Plains region of the U.S.:

Dental Assistant Pay in the Great Plains Region

Dental Assistant Pay in the Great Plains Region

State # Employed Annual Mean Wages Wage Rank*
IA 3,280 $45,650 18th
KS 3,220 $39,000 44th
MN 5,890 $58,890 1st
MO 6,660 $42,260 31st
NE 2,240 $42,330 30th
ND 740 $51,370 8th
SD 1,010 $43,790 27th
U.S. 363,880 $44,710 -------

(*) annual mean wage ranking among the 50 states and the District of Columbia

Source: U.S. Bureau of Labor Statistics OES. Data extracted on December 2, 2023