Friday, December 31, 2021

Pharmacy Technician Pay in the Great Lakes States

Pharmacy technician employment in the U.S. stood at over 415,000 per May 2020 data published earlier this year by the U.S. Bureau of Labor Statistics (BLS). With over 69,000 pharmacy technicians employed, the five-state Great Lakes region accounted for about 16.6% of U.S. pharmacy technician employment. BLS data indicated that the region is a weak one for pharmacy technician pay, as no state in the region recorded a pharmacy technician annual mean wage level that exceeded the national average. Moreover, three states in the region ranked in the bottom third of all U.S. states for pharmacy technician annual mean wages.  From May 2020 BLS data, here is a summary look at pharmacy technician pay in the Great Lakes states:

Pharmacy Technician Pay in the Great Lakes States

Pharmacy Technician Pay in the Great Lakes States

State # Employed Annual Mean Wages Wage Rank*
IL 19,880 $34,700 34th
IN 9,790 $34,200 38th
MI 13,990 $34,090 39th
OH 17,090 $32,520 45th
WI 8,290 $35,780 25th
U.S. 415,310 $36,450 -------

(*) annual mean wage ranking among the 50 states and the District of Columbia

Source: U.S. Bureau of Labor Statistics OES. Data extracted on May 18, 2021

Thursday, December 30, 2021

Healthcare Social Worker Pay in the Great Plains Region

Earlier this year the U.S. Bureau of Labor Statistics (BLS) released May 2020 data indicating that there were over 176,000 healthcare social workers (HSWs) employed in the United States.  The seven-state Great Plains regions accounted for 15,000 of those healthcare social worker jobs.  BLS data reveals the region to be a rather poor one for healthcare social worker pay, as no Great Plains state registered a HSW annual mean wage level that topped the national average of $60,470. Moreover, three states in the region ranked among the ten worst states in the nation for HSW annual mean wages. BLS data from May 2020 reveals the following details about healthcare social worker pay in the Great Plains region:

Healthcare Social Worker Pay in the Great Plains Region

State # Employed Annual Mean Wages Wage Rank*
IA 1,220 $53,850 38th
KS 1,600 $57,550 26th
MN 4,340 $57,960 21st
MO 6,090 $49,050 48th
NE 780 $50,550 46th
ND 400 $56,100 34th
SD 570 $45,430 51st
U.S. 176,110 $60,470 -------

(*) annual mean wage ranking among the 50 states and the District of Columbia

Source: U.S. Bureau of Labor Statistics OES. Data extracted on May 17, 2021

Wednesday, December 29, 2021

The Great Plains Region's Dental Care Shortage

According to December 31, 2021, data from the Health Resources and Services Administration (HRSA), over 64.2 million Americans lived in areas or settings designated as a dental health professional shortage area (HPSA).  A dental health HPSA is a geographic area, population group, or facility where access to dental care is substandard because it lacks a sufficient number of dentists relative to the size of the HPSA population.  HPSAs in the seven-state Great Plains region accounted for about 5.8% of the U.S. population who lived in dental care shortage areas.  The HRSA estimates that HPSAs in the Great Plains states would need 698 more dentists in order to eliminate the dental care shortage in the region.  This shortfall represented about 6.2% of the national dental care shortage.  Here is a summary look at the Great Plains region's dental care shortage:

The Great Plains Region's Dental Care Shortage

State (1) HPSAs (2) Population (3) Shortage
IA 132 380,841 64
KS 177 590,331 82
MN 179 794,540 145
MO 319 1,675,973 365
NE 76 1,664 0
ND 65 121,871 11
SD 71 155,151 31
Region 1,019 3,720,371 698
U.S. 6,803 64,236,250 11,181

(1) Designated Geographic, Population Group and Facility HPSAs with a dental care shortage
(2) Population of designated HPSAs
(3) Dental Care practitioners needed to remove HPSA Designation

Source:  Designated HPSA Quarterly Summary, 12/31/21 (HRSA)

New England's Mental Health Care Shortage

The Health Resources and Services Administration (HRSA) designates a geographic area, population group or facility where access to mental health care providers is substandard as a health professional shortage area (HPSA) for mental health care services. This designation can be based on the size of the HPSA's population relative to either (a) the number of psychiatrists, or (b) the combined number of psychiatrists, clinical psychologists, clinical social workers and certain other types of mental health care providers that serve the community. Most mental health care shortage designations are currently based on an HPSA's population relative to the number of psychiatrists serving the community.

As of December 31, 2021, mental health care HPSAs in the six-state New England region accounted for about 1.6% of the U.S. population who lived in mental health care shortage areas, and about 1.8% of the overall national shortage of mental health care providers.  To eliminate the shortage, the HRSA estimates that New England HPSAs would need 122 additional mental health care providers.  A further review of HRSA data reveals the following about New England's mental health care shortage:

New England's Mental Health Care Shortage

New England's Mental Health Care Shortage

State (1) HPSAs (2) Population (3) Shortage
CT 38 1,110,816 62
ME 65 326,422 28
MA 57 310,639 19
NH 22 93,150 3
RI 12 395,297 10
VT 11 N/A N/A
Region 205 2,236,324 122
U.S. 6,078 136,575,592 6,851

(1) Designated Geographic, Population Group and Facility HPSAs with a mental health care shortage
(2) Population of designated HPSAs
(3) Mental Health Care practitioners needed to remove HPSA Designation

Source:  Designated HPSA Quarterly Summary, 12/31/21 (HRSA)

Tuesday, December 28, 2021

National Cancer Institute, Our Trusted Link for December 2021


National Cancer Institute

Since 1937, the National Cancer Institute has been the national leader in conducting cancer research, as well as training healthcare workers to diagnose and treat cancer.  Cancer was the first non-communicable disease for which research and treatment was funded by the U.S. government. 

Now part of the National Institutes of Health (NIH), the National Cancer Institute (NCI) has the largest budget and research program within NIH: over $6 billion, with over 40% dedicated to research project grants. NCI supports and performs research on the causes, genomics, prevention, diagnosis, and treatment of cancer. 

Milestones include

  • 1940: First issue of the Journal of the National Cancer Institute (now independent of NCI)
  • 1955: NCI created the Clinical Trials Cooperative Group Program
  • 1957: The first cancer, choriocarcinoma, was cured with chemotherapy at NCI
  • 1960: NCI began funding government-supported cancer centers.
  • 1971: The National Cancer Act of 1971 declares "war on cancer," creates the National Cancer Advisory Board, increases funding 
  • 1973: SEER program established to collect U.S. cancer statistics
  • 1976: Cancer Information Service launched (800-4-CANCER) 
  • 1996: Office of Cancer Survivorship established
  • 2016: Genomic Data Commons begins making cancer genomics data available to all researchers

Moonshot: Launched by the Obama Administration, the National Cancer Moonshot is a $1 billion initiative to accelerate the development of new cancer detection and treatments. 

History Project: Created to mark the 50th anniversary of the National Cancer Act of 1971, the Cancer History Project is a free historical resource. 

The Most Active NCI Blogs

Cancer Currents
Cancer Prevention Science
Cancer Data Science Pulse
CGH Spotlight (from Center for Global Health)
NCI Bottom Line (grants and training)

Newsletters 

CCR Milestones from Center for Cancer Research
Global Health Activities from Division of Cancer Control and Population Sciences
DCEG Linkage from Division of Cancer Genetics and Epidemiology
DCTD Pipeline News from Division of Cancer Treatment and Diagnosis
EGRP Cancer Epidemiology News
Office of Cancer Genomics E-Newsletter
Scientific News from NCI’s Behavioral Research Program

Social Media at NCI

    "NCI at a Glance" Infographic

    Nurse Practitioner Pay in the Mid-Eastern U.S.

    Data published by the U.S. Bureau of Labor Statistics (BLS) put the number of nurse practitioners (NPs) working in the United States at more than 211,000 as of May 2020.  More than 33,700 of the nation's nurse practitioner jobs at that time were in the Mid-Eastern region, an area which includes five states and the District of Columbia.  The Mid-Eastern U.S. was one of the best regions of the country for nurse practitioner pay.  More than 73% of nurse practitioners employed in the Mid-Eastern region lived in a state where the NP annual mean wage exceeded the national average of $114,510. Moreover, over 60% of employed NPs in the region lived in New York or New Jersey, two states that ranked among the five best states in the country for nurse practitioner annual mean wages. A closer examination of BLS employment data from May 2020 shows the following about nurse practitioner pay in the Mid-Eastern U.S.:

    Nurse Practitioner Pay in the Mid-Eastern U.S.

    Nurse Practitioner Pay in the Mid-Eastern U.S.

    State # Employed Annual Mean Wages Wage Rank*
    DC 860 $116,150 16th
    DE 740 $112,230 24th
    MD 3,320 $115,240 17th
    NJ 5,800 $130,890 2nd
    NY 14,850 $126,440 4th
    PA 8,150 $111,560 28th
    U.S. 211,280 $114,510 -------

    (*) annual mean wage ranking among the 50 states and the District of Columbia

    Source: U.S. Bureau of Labor Statistics OES. Data extracted on May 17, 2021

    Monday, December 27, 2021

    Dental Hygienist Pay in New England

    Data released earlier this year by the U.S. Bureau of Labor Statistics (BLS) reported nearly 195,000 dental hygienists at work in the United States as of May 2020.  More than 12,000 dental hygienists were employed in the six-state New England region according to the BLS.  The region is a generally good one for dental hygienist pay, with over 80% of the region's practitioners living in a state with a dental hygienist annual mean wage level that was above the national average.  A deeper dive into May 2020 BLS data reveals the following details about dental hygienist pay in New England:

    Dental Hygienist Pay in New England

    Dental Hygienist Pay in New England

    State # Employed Annual Mean Wages Wage Rank*
    CT 3,070 $85,610 12th
    MA 5,420 $84,850 13th
    ME 890 $68,110 40th
    NH 1,420 $82,150 16th
    RI 730 $75,980 24th
    VT 520 $74,010 27th
    U.S. 194,830 $78,050 -------

    (*) annual mean wage ranking among the 50 states and the District of Columbia

    Source: U.S. Bureau of Labor Statistics OES. Data extracted on May 17, 2021
    Saturday, December 25, 2021

    The Great Lakes Region's Primary Care Shortage

    As designated by the Health Resources and Services Administration (HRSA), a primary care health professional shortage area (HPSA) is a geographic area, population group, or facility that has poor access to primary care services because it lacks a sufficient number of primary care providers, including Doctors of Medicine (MD) or Doctors of Osteopathy (DO) who provide services as general or family practitioners, general internal medicine physicians, pediatricians, obstetricians and gynecologists.  As of December 31, 2021, primary care HPSAs in the five-state Great Lakes region accounted for just over 13.4% of the U.S. population who lived in primary care shortage areas, and about 11% of the nation's overall shortage of primary care providers.  To eliminate the shortage, the HRSA estimated that Great Lakes region HPSAs would need 1,680 additional primary care providers.  A further study of HRSA data reveals the following about the Great Lakes region's primary care shortage:


    The Great Lakes Region's Primary Care Shortage

    The Great Lakes Region's Primary Care Shortage

    State (1) HPSAs (2) Population (3) Shortage
    IL 269 3,489,109 567
    IN 117 2,119,334 194
    MI 276 2,985,151 489
    OH 167 1,918,631 298
    WI 118 1,136,187 132
    Region 94711,648,412 1,680
    U.S. 7,613 86,473,101 15,184

    (1) Designated Geographic, Population Group and Facility HPSAs with a primary care shortage
    (2) Population of designated HPSAs
    (3) Primary Care practitioners needed to remove HPSA Designation

    Source:  Designated HPSA Quarterly Summary, 12/31/21 (HRSA)

    Friday, December 24, 2021

    Nursing Assistant Pay in the Rocky Mountain Region

    Over 1,371,000 nursing assistants were employed as of May 2020 in the United States according to data released earlier this year by the U.S. Bureau of Labor Statistics (BLS).  More than 47,800 of the nation's nursing assistants were employed in the five-state Rocky Mountain region of the country.  A further examination of May 2020 BLS data provides the following details about nursing assistant pay in the Rocky Mountain region:

    Nursing Assistant Pay in the Rocky Mountain Region

    Nursing Assistant Pay in the Rocky Mountain Region


    State # Employed Annual Mean Wages Wage Rank*
    CO 21,310 $34,470 13th
    ID 6,600 $29,370 36th
    MT 5,110 $31,720 26th
    UT 12,050 $30,240 32nd
    WY 2,810 $33,160 19th
    U.S. 1,371,050 $32,050 -------

    (*) annual mean wage ranking among the 50 states and the District of Columbia

    Source: U.S. Bureau of Labor Statistics OES. Data extracted on May 15, 2021

    Thursday, December 23, 2021

    Medical Assistant Pay in the Southeastern U.S.

    U.S. Bureau of Labor Statistics (BLS) data released earlier this year put the number of medical assistants (MA) at work in the United States at over 710,000 as of May 2020. Per BLS data, approximately 182,000 medical assistant jobs were in the twelve-state Southeastern region of the country. In general, the Southeastern U.S. was the worst in the nation for medical assistant pay, with six states in the region ranked among the ten states in the country with the lowest annual mean wage level for medical assistants. Moreover, as of May 2020, no state in the region recorded a medical assistant annual mean wage level that was above the national average.  A closer examination of BLS data reveals the following details about medical assistant pay in the Southeastern U.S. as of May 2020:

    Medical Assistant Pay in the Southeastern U.S
    Medical Assistant Pay in the Southeastern U.S

    State # Employed Annual Mean Wages Wage Rank*
    AL 9,380 $29,950 50th
    AR 3,580 $31,530 47th
    FL 56,010 $34,800 31st
    GA 25,820 $34,250 37th
    KY 10,110 $33,450 41st
    LA 8,060 $31,110 48th
    MS 3,670 $30,550 49th
    NC 20,240 $34,540 35th
    SC 11,840 $33,010 42nd
    TN 15,900 $33,990 38th
    VA 14,330 $36,730 24th
    WV 3,280 $29,820 51st
    U.S. 710,200 $36,930 -------

    (*) annual mean wage ranking among the 50 states and the District of Columbia

    Source: U.S. Bureau of Labor Statistics OES. Data extracted on May 15, 2021

    Tuesday, December 21, 2021

    Family Medicine Physician Pay in the Southwest

    Information published earlier this year by the U.S. Bureau of Labor Statistics (BLS) put the number of employed family medicine physicians in the U.S. at more than 98,000 as of May 2020.  The four-state Southwest U.S. accounted for about 13,000 of the country's employed family medicine physicians.  BLS data reveals the region to be a slightly better than average one for family physician pay.  Although New Mexico ranked among the ten worst states in the nation for family medicine physician annual mean wages, well over 90% of the region's practitioners lived in states where the family medicine physician annual mean wage level was at, or above, the nation average. A closer review of May 2020 BLS data details the following about family medicine physician pay in the Southwest:

    Family Medicine Physician Pay in the Southwest

    Family Medicine Physician Pay in the Southwest


    State # Employed Annual Mean Wages Wage Rank*
    AZ 2,960 $218,920 23rd
    NM 560 $194,260 44th
    OK 1,680 $214,130 30th
    TX 8,010 $220,390 19th
    U.S. 98,590 $214,370 -------

    (*) annual mean wage ranking among the 50 states and the District of Columbia

    Source: U.S. Bureau of Labor Statistics OES. Data extracted on May 12, 2021

    Monday, December 20, 2021

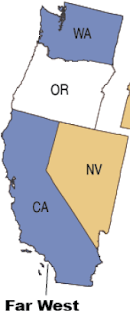
    General Dentist Pay in Far Western U.S. States

    About 96,000 general dentists were employed in the U.S. as of May 2020 according to data recently published by the U.S. Bureau of Labor Statistics (BLS).  Just over 18,000 general dentists were working in the six-state Far Western region of the country.  For general dentists, the region is a mixed bag in terms of pay relative to the national average.  About 2/3rds of the Far West's general dentists live in California, which ranked in the bottom quartile of states for general dentist annual mean wages.  However, the remaining states in the region all recorded general dentist annual mean wage levels above the national average and two states, Alaska and Oregon, ranked among the ten best states in the nation for general dentist pay. An examination of BLS data from May 2020 reveals the following details about general dentist pay in Far Western U.S. states:

    General Dentist Pay in Far Western U.S. States

    General Dentist Pay in Far Western U.S. States

    State # Employed Annual Mean Wages Wage Rank*
    AK 220 $242,850 3rd
    CA 12,040 $160,300 41st
    HI 660 $202,890 14th
    NV 720 $203,450 13th
    OR 1,500 $215,750 7th
    WA 2,910 $187,520 21st
    U.S. 95,920 $180,830 -------

    (*) annual mean wage ranking among the 50 states

    Source: U.S. Bureau of Labor Statistics OES. Data extracted on May 12, 2021

    Saturday, December 18, 2021

    EMT and Paramedic Pay in the Great Lakes States

    Data made available earlier this year by the U.S. Bureau of Labor Statistics (BLS) revealed that over 257,000 EMTs (emergency medical technicians) and paramedics were employed in the United States as of May 2020. The five Great Lakes states accounted for over 40,000 of those EMT and paramedic jobs. Other than in Illinois, which ranked among the ten best states in the nation for EMT and paramedic annual mean wages, the Great Lakes region is a generally weak one for EMT and paramedic pay.  The other four states in the region, which accounted for more than two-thirds of region's EMT and paramedic employment, all recorded an annual mean wage level for EMTs and paramedics that was below the national average. Moreover, two of those states ranked among the ten worst states in the country for EMT and paramedic annual mean wages. Further examination of May 2020 BLS data revealed the following about EMT and paramedic pay in the Great Lakes states:

    EMT and Paramedic Pay in the Great Lakes States

    EMT and Paramedic Pay in the Great Lakes States

    State # Employed Annual Mean Wages Wage Rank*
    IL 12,410 $48,040 6th
    IN 6,330 $36,360 36th
    MI 6,880 $34,410 44th
    OH 9,150 $34,680 42nd
    WI 5,670 $36,790 32nd
    U.S. 257,700 $40,370 -------

    (*) annual mean wage ranking among the 50 states and the District of Columbia

    Source: U.S. Bureau of Labor Statistics OES. Data extracted on May 10, 2021

    Friday, December 17, 2021

    Registered Nurse Pay in the Great Plains States

    Data released earlier this year by the U.S. Bureau of Labor Statistics (BLS) indicated that, as of May 2020, there were over 2,986,000 registered nurses (RNs) employed in the country.  More than 251,000 of those RN jobs were in the seven Great Plains states.  BLS data revealed the Great Plains as one of the weakest regions of the country for registered nurse pay.  Only one state in the region, Minnesota, recorded an RN annual mean wage level that was above the national average, and it was home to only 28% of the region's employed registered nurses. Meanwhile, about 58% of the region's RNs lived in one of four Great Plains states that ranked among the ten states in the country with the lowest annual mean wage levels for registered nurses. Closer examination of BLS data from May 2020 reveals the following details about registered nurse pay in the Great Plains states:

    Registered Nurse Pay in the Great Plains States
    Registered Nurse Pay in the Great Plains States

    State # Employed Annual Mean Wages Wage Rank*
    IA 32,610 $62,570 48th
    KS 29,430 $64,200 45th
    MN 70,820 $80,960 14th
    MO 71,560 $65,900 42nd
    NE 24,060 $69,480 36th
    ND 9,970 $69,630 34th
    SD 13,130 $60,960 50th
    U.S. 2,986,500 $80,010 -------

    (*) annual mean wage ranking among the 50 states and the District of Columbia

    Source: U.S. Bureau of Labor Statistics OES. Data extracted on May 5, 2021

    Wednesday, December 15, 2021

    Physical Therapist Pay in the Mid-Eastern U.S.

    The most recent U.S. Bureau of Labor Statistics (BLS) data on physical therapist (PT) employment put the number of employed PTs in the U.S. at nearly 221,000 as of May 2020.  The Mid-Eastern U.S. region, which encompasses five states and the District of Columbia, accounted for over 39,000 of those physical therapist jobs according to BLS data.  The Mid-Eastern U.S. was a relatively good one for physical therapist pay, with four states in the region ranked among the twelve best states in the nation for physical therapist annual mean wages.  Those four states were home to about 63% of the region's employed PTs.  A deeper examination of BLS data from May 2020 reveals the following about physical therapist pay in the Mid-Eastern U.S.:

    Physical Therapist Pay in the Mid-Eastern U.S.

    Physical Therapist Pay in the Mid-Eastern U.S.

    State # Employed Annual Mean Wages Wage Rank*
    DC 560 $96,090 9th
    DE 930 $97,260 7th
    MD 3,990 $89,650 25th
    NJ 6,960 $100,740 4th
    NY 16,150 $92,860 12th
    PA 10,670 $90,890 20th
    U.S. 220,870 $91,680 -------

    (*) annual mean wage ranking among the 50 states and the District of Columbia

    Source: U.S. Bureau of Labor Statistics OES. Data extracted on May 2, 2021

    Tuesday, December 14, 2021

    Pharmacist Pay in New England

    Recent data from the U.S. Bureau of Labor Statistics (BLS) revealed that there were more than 315,000 pharmacists employed in the United States as of May 2020.  Over 15,400 employed pharmacists lived in the six-state New England region.  Although Maine, Vermont, and New Hampshire ranked about the eleven best states in the nation for pharmacist annual mean wages, the region was not a particularly good one for pharmacist pay, as nearly 80% of the region's pharmacists lived in states where the annual mean wage was below the national average.  A deeper dive into BLS data from May 2020 reveals the following about pharmacist pay in New England:

    Pharmacist Pay in New England

    Pharmacist Pay in New England

    State # Employed Annual Mean Wages Wage Rank*
    CT 3,420 $124,820 19th
    MA 7,560 $121,450 32nd
    ME 1,320 $134,100 4th
    NH 1,300 $127,990 11th
    RI 1,340 $115,050 50th
    VT 530 $131,910 5th
    U.S. 315,470 $125,460 -------

    (*) annual mean wage ranking among the 50 states and the District of Columbia

    Source: U.S. Bureau of Labor Statistics OES. Data extracted on May 2, 2021

    Sunday, December 12, 2021

    Licensed Practical Nurse Pay in the Rocky Mountain Region

    May 2020 employment data published recently by the U.S. Bureau of Labor Statistics (BLS) reported that there were more than 676,000 licensed practical nurses (LPNs) employed in the United States.  Known as licensed vocational nurses (LVNs) in some parts of the country, LPNs make up one of the largest healthcare occupations in the U.S.  Approximately 11,600 of those LPN jobs were in the five-state Rocky Mountain region of the country. Except in Colorado, which ranked among the top 15 states nationally for LPN annual mean wages, licensed practical nurses in the region were likely to earn less than the national average annual mean wage for LPNs.  A closer review of BLS data from May 2020 reveals the following details about licensed practical nurse pay in the Rocky Mountain region:

    Licensed Practical Nurse Pay in the Rocky Mountain Region

    Licensed Practical Nurse Pay in the Rocky Mountain Region


    State # Employed Annual Mean Wages Wage Rank*
    CO 4,960 $54,310 15th
    ID 2,520 $48,640 25th
    MT 1,850 $46,010 36th
    UT 1,860 $47,550 31st
    WY 440 $48,980 24th
    U.S. 676,440 $50,090 -------

    (*) annual mean wage ranking among the 50 states and the District of Columbia

    Source: U.S. Bureau of Labor Statistics OES. Data extracted on April 26, 2021