Tuesday, January 31, 2023

Medicare Skilled Nursing Facility Beds in New England

Skilled Nursing Facilities (SNFs) serve the needs of more than 62 million Americans with Medicare Part A SNF coverage.  SNFs are institutional medical providers equipped and staffed to give skilled nursing care on a daily basis.  In most cases, SNFs can also provide skilled rehabilitative care and certain other related services.  More than 15,000 skilled nursing facilities, having over 1,588,000 beds, participated in the Medicare program in the calendar year 2020.

As of 2020, New England was home to 856 skilled nursing facilities, with over 93,000 beds, that participated in the Medicare program.  Relative to other regions of the country, New England's Medicare enrollees are well-served by SNFs as the region houses more of Medicare's SNF bed capacity (5.9%) than its share of the national Medicare enrollee population (4.9%).  Here is a summary look at Medicare skilled nursing facility beds in New England:

Medicare Skilled Nursing Facility Beds in New England

Medicare Skilled Nursing Facility Beds in New England

Area # Part A Enrollees # SNFs # Beds
CT 689,967 209 25,138
MA 1,351,220 371 42,800
ME 345,665 93 6,546
NH 307,435 70 7,139
RI 222,702 78 8,350
VT 151,220 35 3,077
Region 3,068,210 856 93,050
National* 62,498,751 15,015 1,588,755
% of National 4.9% 5.7% 5.9%

* National totals include U.S. territories

Data Source:  CMS Program Statistics, Table: MDCR PROVIDERS 4. Medicare Providers:  Number of Medicare Certified Hospitals and Skilled Nursing Facilities, and Number of Beds, by State, Territories, Possessions, and Other, Calendar Year 2020

Monday, January 30, 2023

Male vs. Female Homicide Rates in the Great Lakes Region

The United States recorded over 24,500 homicide deaths in 2020.  Of that total, 4,122 were in the five-state Great Lakes region.   As seen throughout the U.S., the male homicide rate in the Great Lakes region was significantly higher than the female rate.  Overall, the Great Lakes region had the second-highest regional homicide death rate in 2020.  Consistent with that standing, the homicide rates for both genders in the region were higher than the respective national gender homicide rates. A closer examination of data from the National Center for Health Statistics produces the following details about male vs. female homicide rates in the Great Lakes region:

Male vs. Female Homicide Rates in the Great Lakes Region

Male vs. Female Homicide Rates in the Great Lakes Region

Deaths Population Death Rate*
Regionwide 4,122 46,834,910 8.8
     Male 3,389 23,061,455 14.7
     Female 733 23,773,455 3.1
Nationwide     24,576 329,484,123 7.5
     Male 19,958 162,256,202 12.3
     Female 4,618 167,227,921 2.8

(*) number of homicide deaths per 100,000 population

Report Period: 2020

States in Region:  Illinois, Indiana, Michigan, Ohio, and Wisconsin

Source: CDC Wonder. Centers for Disease Control and Prevention, National Center for Health Statistics. Underlying Cause of Death 1999-2020 on CDC WONDER Online Database, released in 2021. Data are from the Multiple Cause of Death Files, 1999-2020, as compiled from data provided by the 57 vital statistics jurisdictions through the Vital Statistics Cooperative Program. Accessed on January 21, 2023

Sunday, January 29, 2023

Urban vs. Rural Heart Disease Death Rates in the Far Western U.S.

In 2020 there were nearly 96,200 deaths in the six-state Far Western U.S. region that were attributable to heart disease.  Relative to the size of its population, the number of heart disease deaths per 100,000 population in the Far West was 19.1% below the national average in 2020.  While the region as a whole compared favorably to the national heart disease death rate, most of the better results were concentrated in counties in the region's medium-sized to large metropolitan areas. In rural areas and smaller population centers in the Far West, counties recorded heart disease death rates in 2020 that were materially higher than in the whole region or the nation.  A closer review of data from the National Center for Health Statistics (NCHS) provides the following details about urban vs. rural heart disease death rates in the Far Western U.S.:

Urban vs. Rural Heart Disease Death Rates in the Far Western U.S.

Urban vs. Rural Heart Disease Death Rates in the Far Western U.S.

County Classification Deaths Population Death Rate*
Large Central Metro 50,688 30,332,613 167.1
Large Fringe Metro 13,502 8,675,719 155.6
Medium Metro 19,067 11,295,695 168.8
Small Metro 6,269 3,184,983 196.8
Micropolitan (Nonmetro) 5,557 2,325,131 239.0
NonCore (Nonmetro) 1,733 756,133 229.2
     Region 96,816 56,570,274 171.1
Nationally 696,962 329,484,123 211.5

(*) number of heart disease deaths per 100,000 population

Report Period: 2020

States in region:  Alaska, California, Hawaii, Nevada, Oregon, and Washington

See the 2013 NCHS Urban-Rural Classification Scheme for additional information on population categories, including a map of which U.S. counties fall in which categories.

Source: CDC Wonder. Centers for Disease Control and Prevention, National Center for Health Statistics. Underlying Cause of Death 1999-2020 on CDC WONDER Online Database, released in 2021. Data are from the Multiple Cause of Death Files, 1999-2020, as compiled from data provided by the 57 vital statistics jurisdictions through the Vital Statistics Cooperative Program. Accessed on January 21, 2023

Saturday, January 28, 2023

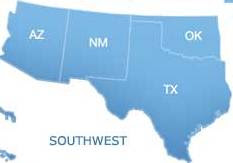
Medicare Long Term Care Hospital Beds in the Southwestern U.S.

Long Term Care Hospitals (LTCHs) provide services to over 62 million Americans having Medicare Part A long-term care coverage.  Providing hospital care to individuals with complex medical conditions that require longer duration inpatient care (in excess of 25 days on average), LTCHs are an important part of the nation's hospital infrastructure.  As of the calendar year 2020, the Medicare program counted among its participating providers 347 Long Term Care Hospitals that had over 23,700 total beds.

In the calendar year 2020, participating in the Medicare program in the four-state Southwestern U.S. were 71 LTCHs with 4,057 total beds.  The region's Medicare enrollees are very well served for LTCH bed capacity in comparison to other regions of the country.  Home to about 10.9% of the nation's Medicare Part A enrollees, the Southwest accounted for a disproportionately greater 17.1% share of the Medicare program's long-term care hospital beds.  Here is a deeper look at Medicare Long Term Care hospital beds in the Southwestern U.S.:

Medicare Long Term Care Hospital Beds in the Southwestern U.S.

Medicare Long-Term Care Hospital Beds in the Southwestern U.S.

# Part A Enrollees # Hospitals # Beds
AZ 1,359,840 6 359
NM 427,346 3 106
OK 753,140 9 398
TX 4,275,461 53 3,194
Region 6,815,787 71 4,057
National* 62,498,751 347 23,748
% of National 10.9% 20.5% 17.1%

* National totals include U.S. territories

Data Source:  CMS Program Statistics, Table: MDCR PROVIDERS 4. Medicare Providers:  Number of Medicare Certified Hospitals and Skilled Nursing Facilities, and Number of Beds, by State, Territories, Possessions, and Other, Calendar Year 2020
Friday, January 27, 2023

Medicare Rehabilitation Hospital Beds in the Far West

Rehabilitation hospitals are part of the hospital network that serves the needs of over 62 million Americans having Medicare Part A insurance coverage.  Over 6,200 hospitals of all types, with over 927,000 beds in total, participated in the Medicare program as of the calendar year 2020.  Rehabilitation hospitals accounted for approximately 5% of those hospitals and a bit more than 2% of those hospital beds.

In the calendar year 2020, Medicare Part A enrollees in the six-state Far West region were, on a relative basis, underserved by rehabilitation hospitals.  Although home to over 15% of the nation's Part A enrollees, the region was home to just 6.2% of the rehabilitation hospital beds participating in the Medicare program.  Here is a state-level summary look at Medicare rehabilitation hospital beds in the Far West region of the U.S.:

Medicare Rehabilitation Hospital Beds in the Far West

Medicare Rehabilitation Hospital Beds in the Far West

Area # Part A Enrollees # Hospitals # Beds
AK 104,078 0 0
CA 6,281,323 9 638
HI 280,787 1 100
NV 546,759 5 315
OR 885,544 0 0
WA 1,397,182 2 162
Region 9,495,673 17 1,215
National* 62,498,751 314 19,481
% of National 15.2% 5.4% 6.2%

* National totals include U.S. territories

Data Source:  CMS Program Statistics, Table: MDCR PROVIDERS 4. Medicare Providers:  Number of Medicare Certified Hospitals and Skilled Nursing Facilities, and Number of Beds, by State, Territories, Possessions and Other, Calendar Year 2020

Thursday, January 26, 2023

Male vs. Female Homicide Rates in New England

In 2020, the six-state New England region recorded 413 homicide deaths, or about 1.7% of the national total that year.  Consistent with a pattern seen throughout the country, the homicide rate for women in New England was substantially lower than it was for men.  Homicide rates for both genders in the region were considerably lower than the national average as New England as a whole had what was easily the lowest regional homicide death rate in 2020. Further examination of data from the CDC's National Center for Health Statistics provides the following details about male vs. female homicide rates in New England:

Male vs. Female Homicide Rates in New England

Male vs. Female Homicide Rates in New England

Deaths Population Death Rate*
Regionwide 413 14,847,468 2.8
     Male 339 7,242,931 4.7
     Female 74 7,604,537 1.0
Nationwide     24,576 329,484,123 7.5
     Male 19,958 162,256,202 12.3
     Female 4,618 167,227,921 2.8

(*) number of homicide deaths per 100,000 population

Report Period: 2020

States in Region:  Connecticut, Maine, Massachusetts, New Hampshire, Rhode Island, and Vermont

Source: CDC Wonder. Centers for Disease Control and Prevention, National Center for Health Statistics. Underlying Cause of Death 1999-2020 on CDC WONDER Online Database, released in 2021. Data are from the Multiple Cause of Death Files, 1999-2020, as compiled from data provided by the 57 vital statistics jurisdictions through the Vital Statistics Cooperative Program. Accessed on January 16, 2023

Wednesday, January 25, 2023

Urban vs. Rural Cancer Death Rates in the Southwestern U.S.

In 2020, cancer accounted for over 66,800 deaths in the four-state Southwestern U.S.  Relative to the size of its population, the U.S. Southwest had a cancer death rate of 155.9 deaths per 100,000 population in 2020, which was about 14.7% below the national average.  This favorable comparison to the national average in 2020 was wholly attributable to cancer death rates in counties in the region's large and medium metro areas, where cancer death rates were considerably lower than the national average. On the other hand, counties in smaller communities and rural areas in the Southwest had cancer death rates in 2020 that were substantially higher than in the nation as a whole.  A closer review of data from the National Center for Health Statistics (NCHS) reveals the following details about urban vs. rural cancer death rates in the Southwestern U.S.:

Urban vs. Rural Cancer Death ates in the Southwestern U.S.

Urban vs. Rural Cancer Death Rates in the Southwestern U.S.

County Classification Deaths Population Death Rate*
Large Central Metro 25,226 19,280,005 130.8
Large Fringe Metro 10,488 7,012,596 149.6
Medium Metro 12,335 7,702,280 160.1
Small Metro 6,678 3,423,216 195.1
Micropolitan (Nonmetro) 6,708 3,284,626 204.2
NonCore (Nonmetro) 5,400 2,166,539 249.2
     Region 66,835 42,869,262 155.9
Nationally 602,350 329,484,123 182.8

(*) number of cancer deaths per 100,000 population

Report Period: 2020

States in region:  Arizona, New Mexico, Oklahoma, and Texas

See the 2013 NCHS Urban-Rural Classification Scheme for additional information on population categories, including a map of which U.S. counties fall in which categories.

Source: CDC Wonder. Centers for Disease Control and Prevention, National Center for Health Statistics. Underlying Cause of Death 1999-2020 on CDC WONDER Online Database, released in 2021. Data are from the Multiple Cause of Death Files, 1999-2020, as compiled from data provided by the 57 vital statistics jurisdictions through the Vital Statistics Cooperative Program. Accessed on January 16, 2023

Tuesday, January 24, 2023

Medicare Psychiatric Hospital Beds in the Mid-East States

Psychiatric hospitals are an important component of the hospital infrastructure that serves over 62 million Americans having Medicare Part A insurance coverage.  Over 6,200 hospitals of all types, having over 927,300 beds in total, were participating in the Medicare program in the calendar year 2020.  About 9.9% of those hospitals, and 6.6% of those hospital beds, were provided by psychiatric hospitals.  

In the calendar year 2020, the Mid-East region of the U.S. was home to 81 psychiatric hospitals, with over 14,300 beds, that were participating in the Medicare program.  Medicare enrollees in the Mid-East states are well served by psychiatric bed capacity.  Although the region is home to about 15% of the nation's Medicare Part A enrollment, it holds close to 23.5% of the Medicare program's psychiatric hospital beds.  Here is a state-level look at Medicare psychiatric hospital beds in the Mid-East states of the U.S.:

Medicare Psychiatric Hospital Beds in the Mid-East States

Medicare Psychiatric Hospital Beds in the Mid-East States

# Part A Enrollees # Hospitals # Beds
DE 214,919 5 475
DC 92,795 2 396
MD 1,056,328 7 1,545
NJ 1,622,244 14 2,693
NY 3,652,873 27 5,697
PA 2,765,923 26 3,538
Region 9,405,082 81 14,344
National* 62,498,751 613 61,129
% of National 15.0% 13.2% 23.5%

* National totals include U.S. territories

Data Source:  CMS Program Statistics, Table: MDCR PROVIDERS 4. Medicare Providers:  Number of Medicare Certified Hospitals and Skilled Nursing Facilities, and Number of Beds, by State, Territories, Possessions, and Other, the Calendar Year 2020

Monday, January 23, 2023

Medicare Short-Stay Hospital Beds in the Great Plains Region

Providing acute inpatient care, short-stay hospitals are the backbone of the hospital infrastructure that serves over 62 million Americans having Medicare Part A insurance coverage.  As of the calendar year 2020, more than 6,200 hospitals of all kinds participated in the Medicare program with over 56% of those participating hospitals being short-stay hospitals.  More importantly, those participating short-stay hospitals accounted for almost 83.6% of the total hospital beds serving the inpatient hospital care needs of Medicare Part A enrollees.

As of the calendar year 2020, there were 251 short-stay hospitals in the seven-state Great Plains regions, with just over 57,300 beds, participating in the Medicare program.  While the region was home to about 6.6% of the nation's Medicare Part A enrollment, it held 7.4% of the Medicare program's short-stay hospital beds.  Here is a state-level look at Medicare short-stay hospital beds in the Great Plains region:

Medicare Short Stay Hospital Beds in the Great Plains Region

Medicare Short Stay Hospital Beds in the Great Plains Region

# Part A Enrollees # Hospitals # Beds
IA 637,145 33 8,550
KS 545,607 49 7,851
MN 1,045,280 48 13,297
MO 1,246,928 68 18,739
NE 353,434 26 4,306
ND 133,840 8 2,247
SD 180,149 19 2,338
Region 4,142,384 251 57,328
National* 62,498,571 3,481 774,873
% of National 6.6% 7.2% 7.4%

* National totals include U.S. territories

Source:  CMS Program Statistics, Table: MDCR PROVIDERS 4. Medicare Providers:  Number of Medicare Certified Hospitals and Skilled Nursing Facilities, and Number of Beds, by State, Territories, Possessions, and Other, the Calendar Year 2020

Sunday, January 22, 2023

Male vs. Female Homicide Death Rates in the Mid-Eastern U.S.

More than 24,500 deaths in the United States in 2020 were attributable to homicide incidents.  The Mid-Eastern region of the country, which encompasses the District of Columbia and five states, accounted for 3,153 of those homicide fatalities.   In keeping with a national pattern, the homicide death rate for females in the region was substantially lower than it was for males.  Homicide death rates for both genders in the region were materially lower than the national average, which is not surprising given that the Mid-Eastern region collectively had the fourth lowest regional homicide death rate in 2020. A dive into data from the CDC's National Center for Health Statistics provides the following details about male vs. female homicide death rates in the Mid-Eastern U.S.:

Male vs. Female Homicide Death Rates in the Mid-Eastern U.S

Male vs. Female Homicide Death Rates in the Mid-Eastern U.S

Deaths Population Death Rate*
Regionwide 3,153 48,757,828 6.5
     Male 2,644 23,747,834 11.1
     Female 509 25,009,994 2.0
Nationwide     24,576 329,484,123 7.5
     Male 19,958 162,256,202 12.3
     Female 4,618 167,227,921 2.8

(*) number of homicide deaths per 100,000 population

Report Period: 2020

States in Region:  Delaware, Maryland, New Jersey, New York, Pennsylvania, and the District of Columbia

Source: CDC Wonder. Centers for Disease Control and Prevention, National Center for Health Statistics. Underlying Cause of Death 1999-2020 on CDC WONDER Online Database, released in 2021. Data are from the Multiple Cause of Death Files, 1999-2020, as compiled from data provided by the 57 vital statistics jurisdictions through the Vital Statistics Cooperative Program. Accessed on January 14, 2023

Saturday, January 21, 2023

Urban vs. Rural Cancer Death Rates in the Southeastern U.S.

Cancer accounted for nearly 172,000 deaths in the twelve-state Southeastern U.S. in 2020.  Relative to the size of its population, the region's cancer death rate of 201.0 deaths per 100,000 population was almost 10% above the national average.  That said, the unfavorable comparison to the national average in 2020 was wholly attributable to cancer death rates in counties in rural areas and small to medium-sized metro areas in the region. Counties in smaller communities and rural areas in the Southeast had cancer death rates in 2020 that were substantially higher than in the nation or in the region as a whole.  A closer examination of data from the National Center for Health Statistics (NCHS) reveals the following about urban vs. rural cancer death rates in the Southeastern U.S.:

Urban vs. Rural Cancer Death Rates in the Southeastern U.S.

Urban vs. Rural Cancer Death Rates in the Southeastern U.S.

County Classification Deaths Population Death Rate*
Large Central Metro 25,167 15,659,372 160.7
Large Fringe Metro 37,595 21,574,094 174.3
Medium Metro 49,402 23,618,936 209.2
Small Metro 21,283 9,583,292 222.1
Micropolitan (Nonmetro) 19,734 8,121,872 243.0
NonCore (Nonmetro) 18,798 7,008,219 268.2
     Region 171,979 85,565,785 201.0
Nationally 602,350 329,484,123 182.8

(*) number of cancer deaths per 100,000 population

Report Period: 2020

States in region:  Alabama, Arkansas, Florida, Georgia, Kentucky, Louisiana, Mississippi, North Carolina, South Carolina, Tennessee, Virginia, and West Virginia

See the 2013 NCHS Urban-Rural Classification Scheme for additional information on population categories, including a map of which U.S. counties fall in which categories.

Source: CDC Wonder. Centers for Disease Control and Prevention, National Center for Health Statistics. Underlying Cause of Death 1999-2020 on CDC WONDER Online Database, released in 2021. Data are from the Multiple Cause of Death Files, 1999-2020, as compiled from data provided by the 57 vital statistics jurisdictions through the Vital Statistics Cooperative Program. Accessed on January 11, 2023

Friday, January 20, 2023

Medicare Skilled Nursing Facility Beds in the Rocky Mountain Region

Skilled Nursing Facilities (SNFs) provide services to over 62 million Americans having Medicare Part A SNF coverage.  Skilled nursing facilities are medical institutions with the equipment and staff to give skilled nursing care on a daily basis. SNFs, in most cases, can also provide skilled rehabilitative care and certain other related services.  Examples of SNF care include physical therapy or intravenous injections that can only be given by a physician or registered nurse. Over 15,000 skilled nursing facilities, having more than 1.5 million beds, were participating in the Medicare program as of the calendar year 2020.

In the calendar year 2020, the Rocky Mountain region was home to 490 skilled nursing facilities, having over 42,600 beds, that were participating in the Medicare program.  This made the region home to about 3.3% of the nation's Medicare Part A enrollees and 2.7% of the program's SNF bed capacity.  Here is a summary look at Medicare skilled nursing facility beds in the Rocky Mountain region:

Medicare Skilled Nursing Facility Beds in the Rocky Mountain Region

Medicare Skilled Nursing Facility Beds in the Rocky Mountain Region

Area # Part A Enrollees # SNFs # Beds
CO 927,390 215 19,341
ID 349,019 82 6,203
MT 237,051 69 6,157
UT 412,009 91 8,063
WY 113,659 33 2,838
Region 2,039,128 490 42,602
National* 62,498,751 15,015 1,588,755
% of National 3.3% 3.3% 2.7%

* National totals include U.S. territories

Data Source:  CMS Program Statistics, Table: MDCR PROVIDERS 4. Medicare Providers:  Number of Medicare Certified Hospitals and Skilled Nursing Facilities, and Number of Beds, by State, Territories, Possessions, and Other, Calendar Year 2020

Thursday, January 19, 2023

Medicare Long Term Care Hospital Beds in the Great Lakes Region

Long Term Care Hospitals (LTCHs) are an integral part of the hospital system that serve the needs of over 62 million Americans having Medicare Part A long-term care coverage.  LTCH services are geared toward individuals with complex medical situations that require extended inpatient care (more than 25 days on average).  As of the calendar year 2020, there were over 6,200 hospitals in total, with more than 927,300 beds, participating in the Medicare program.  LTCHs accounted for about 5.6% and 2.6% of those hospitals and hospital beds, respectively.

In the calendar year 2020, the five-state Great Lakes region of the U.S. was home to 48 long-term care hospitals, with over 3,300 beds, that were participating in the Medicare program.  This made the region home to 14.7% of the nation's Medicare Part A enrollees and 13.9% of the program's long-term care hospital bed capacity.  Here is a summary look at Medicare Long Term Care hospital beds in the Great Lakes region:


Medicare Long Term Care Hospital Beds in the Great Lakes Region

Medicare Long-Term Care Hospital Beds in the Great Lakes Region

Area # Part A Enrollees # Hospitals # Beds
IL 2,246,603 6 898
IN 1,282,040 8 441
MI 2,099,433 12 711
OH 2,368,612 19 1,137
WI 1,200,220 3 125
Region 9,196,909 48 3,312
National* 62,498,751 347 23,748
% of National 14.7% 13.8% 13.9%

* National totals include U.S. territories

Data Source:  CMS Program Statistics, Table: MDCR PROVIDERS 4. Medicare Providers:  Number of Medicare Certified Hospitals and Skilled Nursing Facilities, and Number of Beds, by State, Territories, Possessions, and Other, Calendar Year 2020