Showing posts with label compensation. Show all posts

Monday, September 8, 2025

Family Medicine Physician Pay in the Far West

Recently released data from the U.S. Bureau of Labor Statistics (BLS) put family medicine physician employment in the United States at just over 104,700 as of May 2024. More than 22,840 family medicine physicians were working in the six-state Far West region. A look at BLS data reveals a wide pay disparity for family medicine physicians across the region. Two states in the Far West reported annual mean wages for family medicine physicians that fell below the national average, while three states came in above. Notably, Alaska ranked among the top ten states nationwide for annual mean wages in the field. Data for Nevada & Hawaii was incomplete due to a reporting error. A closer examination of May 2024 BLS data provides the following details about family medicine physician pay in the Far West region:

Family Medicine Physician Pay in the Far West

Family Medicine Physician Pay in the Far West

State # Employed Annual Mean Wages Wage Rank*
AK 650 $286,990 9st
CA 18,640 $257,060 22nd
HI N/A $209,870 47th
NV 360 N/A N/A
OR 1,770 $250,080 24th
WA 1,420 $226,040 39th
U.S. 104,780 $253,047 -------

(*) annual mean wage ranking among the 50 states and the District of Columbia

Source: U.S. Bureau of Labor Statistics OES. Data extracted on September 8, 2025

Thursday, September 4, 2025

Dental Assistant Pay in the Rocky Mountain Region

As of May 2024, the most current date of occupational employment data available from the U.S. Bureau of Labor Statistics (BLS), the BLS reported dental assistant employment in the United States at nearly 287,800. The five-state Rocky Mountain region accounted for over 11,400 of those dental assistant jobs. However, due to a statewide reporting error, Colorado’s employment and wage data were not available in the May 2024 BLS release. Historically, Colorado has been home to approximately 40% of the region’s dental assistants and has consistently recorded wage levels above the national average for the occupation.

In contrast, the available data show that Idaho and Utah—home to another 49% of the region’s dental assistants—ranked in the bottom ten nationally for dental assistant annual mean wages. A closer look at the May 2024 BLS data reveals the following details about dental assistant pay in the Rocky Mountain region:

Dental Assistant Pay in the Rocky Mountain Region

Dental Assistant Pay in the Rocky Mountain Region


State # Employed Annual Mean Wages Wage Rank*
CO N/A N/A N/A
ID 2,860 $42,710 40th
MT 1,540 $45,930 33rd
UT 6,310 $40,260 47th
WY 700 $43,160 38th
U.S. 287,780 $48,225 -------

(*) annual mean wage ranking among the 50 states and the District of Columbia

Source: U.S. Bureau of Labor Statistics OES. Data extracted on September 2, 2025

Saturday, August 30, 2025

Optometrist Pay in the Far Western U.S.

The U.S. Bureau of Labor Statistics' (BLS) latest occupational employment figures put optometrist employment at over 40,900 nationally as of May 2024.  At that time, an estimated 8,940 optometrists were working in the six-state Far Western U.S. region. BLS data shows the region to be a relatively good one for optometrist pay, with only one state in the region recording an annual mean wage level for optometrists that was below the national average for the profession.  The region's two smallest population states, Alaska and Hawaii, ranked among the fifteen best states in the nation for optometrist annual mean wage levels. A deeper review of BLS data from May 2024 provides the following state-level details about optometrist pay in the Far Western U.S. region:

Optometrist Pay in the Far Western U.S.

Optometrist Pay in the Far Western U.S.

State # Employed Annual Mean Wages Wage Rank*
AK 70 $154,110 10th
CA 6,790 $142,850 17th
HI 230 $145,060 14th
NV 360 $138,650 23rd
OR 560 $122,340 43rd
WA 930 $159,450 2nd
U.S. 40,900 $137,190 -------

(*) annual mean wage ranking among the 50 states and the District of Columbia

Source: U.S. Bureau of Labor Statistics OES. Data extracted on August 30, 2025

Thursday, August 28, 2025

Nurse Practitioner Pay in the Rocky Mountain Region

Earlier this year, the U.S. Bureau of Labor Statistics (BLS) released May 2024 data showing that nurse practitioner (NP) employment in the United States had surpassed 303,400. The five-state Rocky Mountain region accounted for just over 3% of those NP jobs. Nurse practitioner pay across the region was moderate, with all states except Wyoming meeting or exceeding the national average. However, it's important to note that due to a statewide data reporting error, employment and wage data for Colorado was unavailable. A closer look at the available BLS data from May 2024 reveals the following about nurse practitioner pay in the Rocky Mountain region:

Nurse Practitioner Pay in the Rocky Mountain Region

Nurse Practitioner Pay in the Rocky Mountain Region


State # Employed Annual Mean Wages Wage Rank*
CO N/A N/A N/A
ID 1,570 $131,380 18th
MT 1,050 $131,560 17th
UT 2,860 $131,680 16th
WY 440 $126,060 34th
U.S. 303,410 $130,077 -------

(*) annual mean wage ranking among the 50 states and the District of Columbia

Source: U.S. Bureau of Labor Statistics OES. Data extracted on August 28, 2025

Wednesday, August 27, 2025

Dental Assistant Pay in the Southeastern U.S.

The most recent occupational employment statistics from the U.S. Bureau of Labor Statistics (BLS) reported that, as of May 2024, there were almost 288,000 dental assistants employed in the United States.  More than 86,000 dental assistants working in May 2024 lived in the twelve-state Southeastern U.S. region.  BLS data reveals the Southeast to be one of the weakest regions of the country for dental assistant pay.  In only one Southeastern states was the average annual mean wage for dental assistants above the profession's national average of $48,225.  Moreover, five states in the region ranked among the ten worst states in the nation for dental assistant annual mean wages, and three other Southeastern states ranked in the bottom third.  A deeper examination of May 2024 BLS data details the following about dental assistant pay in the Southeastern U.S.:

Dental Assistant Pay in the Southeastern U.S

Dental Assistant Pay in the Southeastern U.S

State # Employed Annual Mean Wages Wage Rank*
AL 4,450 $39,600 49th
AR 3,020 $40,730 46th
FL 23,020 $46,670 30th
GA 9,730 $45,510 36th
KY 4,250 $45,720 35th
LA 4,420 $41,450 45th
MS 2,690 $40,160 48th
NC 11,100 $49,270 21st
SC 5,380 $45,890 34th
TN 6,370 $46,680 29th
VA 11,040 $47,900 25th
WV 1,380 $39,280 50th
U.S. 287,780 $48,225 -------

(*) annual mean wage ranking among the 50 states and the District of Columbia

Source: U.S. Bureau of Labor Statistics OES. Data extracted on August 27, 2025

Friday, August 22, 2025

Clinical Lab Tech Pay in the U.S. Mid-East Region

Over 337,000 clinical laboratory technicians and technologists were working in the U.S. as of May 2024 according to data released earlier this summer by the U.S. Bureau of Labor Statistics (BLS).  At that time, just under 47,000 of the nation's clinical lab techs were working in the U.S. Mid-East region, an area which encompasses five states and the District of Columbia.  For clinical lab techs, the Mid-East is one of the better paying regions in the nation.  The average annual mean wage for clinical lab techs in every state in the region, except for Pennsylvania & Maryland, was higher than the national average. Moreover, two states in the region ranked among the ten best states in the country for clinical lab tech annual mean wages.  Further examination of BLS data from May 2024 reveals the following about clinical lab tech pay in the U.S. Mid-East region:

Clinical Lab Tech Pay in the U.S. Mid-East Region

Clinical Lab Tech Pay in the U.S. Mid-East Region

State # Employed Annual Mean Wages Wage Rank*
DC 970 $81,630 3rd
DE 590 $70,570 13th
MD 7,150 $63,210 26th
NJ 7,660 $69,350 15th
NY 18,500 $86,300 1st
PA 11,670 $62,120 29th
U.S. 337,740 $65,012 -------

(*) annual mean wage ranking among the 50 states and the District of Columbia

Source: U.S. Bureau of Labor Statistics OES. Data extracted on August 22, 2025

Tuesday, August 19, 2025

Family Medicine Physician Pay in the Rocky Mountain Region

Per the most recent occupational employment data from the U.S. Bureau of Labor Statistics (BLS), the number of family medicine physicians employed in the United States came in at more than 104,000 as of May 2024.  Over 2,250 family medicine physicians were employed at that time in the five-state Rocky Mountain region.  BLS data indicates that the region performed relatively well in terms of family physician compensation. Idaho ranked first nationally for annual mean wages among family medicine physicians, while all other states in the region with available data reported wage levels at or above the national average. However, due to technical issues during data collection, Colorado’s data could not be reported. A closer examination of BLS May 2024 data provides the following details about family medicine physician pay in the Rocky Mountain region:

Family Medicine Physician Pay in the Rocky Mountain Region

Family Medicine Physician Pay in the Rocky Mountain Region


State # Employed Annual Mean Wages Wage Rank*
CO N/A N/A N/A
ID 1040 $322,630 1st
MT 440 $275,990 14th
UT 650 $269,090 17th
WY 120 $271,290 15th
U.S. 104,780 $253,047 -------

(*) annual mean wage ranking among the 50 states and the District of Columbia

Source: U.S. Bureau of Labor Statistics OES. Data extracted on August 19, 2025

Monday, August 11, 2025

Dental Assistant Pay in New England

Nearly 288,800 dental assistants were employed in the United States as of May 2024 per the latest available occupational employment data from the U.S. Bureau of Labor Statistics (BLS).  Over 17,600 dental assistants at work in May 2024 lived in the six-state New England region of the country.  BLS data reveals New England to be one of the better regions of the country for dental assistant pay.  Every state in New England, except Rhode Island, recorded an annual mean wage level for dental assistants that was above the national average for the profession, with three states in the region, Massachusetts, Maine, and Vermont, ranked among the top ten states nationally for that pay metric.  A deeper dive into May 2024 BLS data details the following about dental assistant pay in New England:

Dental Assistant Pay in New England

Dental Assistant Pay in New England

State # Employed Annual Mean Wages Wage Rank*
CT 3,740 $51,540 13th
MA 9,250 $56,790 4th
ME 1,450 $54,190 9th
NH 1,400 $52,850 11th
RI 1,120 $51,700 12th
VT 650 $54,570 8th
U.S. 287,780 $48,225 -------

(*) annual mean wage ranking among the 50 states and the District of Columbia

Source: U.S. Bureau of Labor Statistics OES. Data extracted on August 11, 2025

Friday, August 1, 2025

Speech Language Pathologist Pay in the Great Lakes Region

Nearly 174,000 speech language pathologists (SLPs) were employed in the United States as of May 2024 according to the latest occupational employment data available from the U.S. Bureau of Labor Statistics (BLS).  More than 27,460 employed SLPs were living in the five-state Great Lakes region at that time.  BLS data revealed the region to be a subpar one for speech language pathologist pay, as no Great Lakes state recorded a SLP annual mean wage level that topped the national average for the profession.  A further examination of May 2024 BLS data reveals the following state-level details about speech language pathologist pay in the Great Lakes region:

Speech Language Pathologist Pay in the Great Lakes Region

Speech Language Pathologist Pay in the Great Lakes Region

State # Employed Annual Mean Wages Wage Rank*
IL 9,100 $87,940 27th
IN 3,080 $90,180 22nd
MI 4,410 $84,330 35th
OH 7,660 $89,740 24th
WI 3,210 $84,090 37th
U.S. 173,910 $91,089 -------

(*) annual mean wage ranking among the 50 states and the District of Columbia

Source: U.S. Bureau of Labor Statistics OES. Data extracted on August 1, 2025

Wednesday, July 23, 2025

Nurse Practitioner Pay in New England

May 2020 data released earlier this year by the U.S. Bureau of Labor Statistics (BLS) put nurse practitioner (NP) employment in the United States at more than 303,000.  The six-state New England region held more than 17,900 nurse practitioner jobs at that time.  BLS data indicated New England to be a moderately good one for nurse practitioner pay, despite the fact that two states in the region had a NP annual mean wage level that was below the national average. The other four states in the region, all of whom had NP annual mean wage levels higher than the national average, were home to over three-quarters of the region's NPs. Moreover, half the NPs in the region lived in Massachusetts, a state that ranked among the ten best states in the country for nurse practitioner annual mean wages. A closer examination of BLS data from May 2024 shows the following about nurse practitioner pay in New England:

Nurse Practitioner Pay in New England

Nurse Practitioner Pay in New England

State # Employed Annual Mean Wages Wage Rank*
CT 3,680 $141,140 7th
MA 8,920 $145,140 4th
ME 1,630 $127,750 28th
NH 1,790 $133,660 13th
RI 1,200 $139,600 9th
VT 680 $130,580 20th
U.S. 303,410 $130,077 -------

(*) annual mean wage ranking among the 50 states and the District of Columbia

Source: U.S. Bureau of Labor Statistics OES. Data extracted on July 23, 2025

Monday, July 21, 2025

Family Medicine Physician Pay in the Southeast

The most current occupational employment data from the U.S. Bureau of Labor Statistics (BLS) put the number of family medicine physicians employed in the United States at more than 104,000 as of May 20204 More than 24,700 family medicine physicians were employed at that time in the twelve-state Southeast region of the country.  BLS data reveals the region to have much disparity in family physician pay.  Four states in the region ranked among the top third of all states for family medicine physician annual mean wages, while at the same time seven other Southeastern states ranked among the bottom third of states on the same metric.  Overall, however, the region was a subpar one for family physician pay as the data showed about 67% of the region's practitioners lived in a state where the annual mean wage for family medicine physicians was below the national average.  A closer examination of May 2024 data from the BLS details the following about family medicine physician pay in the Southeast:

Family Medicine Physician Pay in the Southeast

State # Employed Annual Mean Wages Wage Rank*
AL 380 $212,590 46th
AR 1,070 $117,030 49th
FL 7,580 $243,800 31st
GA 3,250 $286,050 10th
KY 1,520 $277,570 12th
LA 910 $238,000 34th
MS 780 $261,520 20th
NC 1,940 $226,820 38th
SC 1,060 $253,640 25th
TN 2,520 $256,650 23rd
VA 3,480 $220,010 43rd
WV 230 $249,170 27th
U.S. 104,780 $253,047 -------

(*) annual mean wage ranking among the 50 states and the District of Columbia

Source: U.S. Bureau of Labor Statistics OES. Data extracted on July 21, 2025

Monday, July 7, 2025

Nurse Practitioner Pay in the Mid-Eastern U.S.

Data published by the U.S. Bureau of Labor Statistics (BLS) put the number of nurse practitioners (NPs) working in the United States at more than 303,000 as of May 2024.  More than 49,500 of the nation's nurse practitioner jobs at that time were in the Mid-Eastern region, an area which includes five states and the District of Columbia.  The Mid-Eastern U.S. was one of the best regions of the country for nurse practitioner pay.  Moreover, over 60% of employed NPs in the region lived in New York, New Jersey or DC, three states that ranked among the ten best states in the country for nurse practitioner annual mean wages. A closer examination of BLS employment data from May 2024 shows the following about nurse practitioner pay in the Mid-Eastern U.S.:

Nurse Practitioner Pay in the Mid-Eastern U.S.

Nurse Practitioner Pay in the Mid-Eastern U.S.

State # Employed Annual Mean Wages Wage Rank*
DC 1210 $130,190 22nd
DE 790 $137,600 10th
MD 6,640 $127,100 31st
NJ 9,590 $140,470 8th
NY 20,430 $148,410 2nd
PA 10,860 $126,730 32nd
U.S. 303,410 $130,077 -------

(*) annual mean wage ranking among the 50 states and the District of Columbia

Source: U.S. Bureau of Labor Statistics OES. Data extracted on July 7, 2025

Thursday, July 3, 2025

Family Medicine Physician Pay in the Great Lakes Region

Information published recently by the U.S. Bureau of Labor Statistics (BLS) put the number of family medicine physicians employed in the United States at more than 104,000 as of May 2024.  Almost 10,000 family medicine physicians were employed at that time in the five-state Great Lakes region.  BLS data reveals the region to have much disparity in family physician pay.  Indiana and Wisconsin are both top ten states nationally for family medicine physician annual mean wages.  However, more than 70% of Great Lakes region family medicine physicians live in other states in the region, all of which register family physician annual mean wage levels below the national average.  A closer examination of May 2024 data from the BLS details the following about family medicine physician pay in the Great Lakes region:

Family Medicine Physician Pay in the Great Lakes Region

Family Medicine Physician Pay in the Great Lakes Region

State # Employed Annual Mean Wages Wage Rank*
IL 1,540 $206,010 48th
IN 1,700 $295,310 5th
MI 4,400 $222,500 41st
OH 1,780 $230,400 36th
WI 1,510 $293,630 6th
U.S. 98,590 $214,370 -------

(*) annual mean wage ranking among the 50 states and the District of Columbia

Source: U.S. Bureau of Labor Statistics OES. Data extracted on July 3, 2025

Tuesday, June 24, 2025

Dental Assistant Pay in the Far West U.S.

U.S. Bureau of Labor Statistics (BLS) data released earlier this year indicated that over 287,000 dental assistants were employed in the United States as of May 2024.  At that time, roughly 79,970 dental assistants were working in the six-state Far West region of the country.  Although dental assistant annual mean wage levels were poor in Hawaii and Nevada, BLS data revealed the Far West U.S. to be a modestly good one for dental assistant pay.  Over 93% of the region's dental assistants lived in a state where the annual mean wage level for dental assistants was above the national average.  Moreover, this included four states that ranked among the ten best states in the nation for dental assistant annual mean wages.  A closer review of May 2024 BLS data reveals the following about dental assistant pay in the Far West U.S.:

Dental Assistant Pay in the Far West U.S.

Dental Assistant Pay in the Far West U.S.

State # Employed Annual Mean Wages Wage Rank*
AK 1,080 $54,720 6th
CA 54,580 $53,570 10th
HI 1,610 $42,130 44th
NV 3,890 $47,320 26nd
OR 5,480 $57,690 2nd
WA 13,330 $56,140 5th
U.S. 387,780 $48,225 -------

(*) annual mean wage ranking among the 50 states and the District of Columbia

Source: U.S. Bureau of Labor Statistics OES. Data extracted on June 24, 2025

Friday, June 13, 2025

Clinical Lab Tech Pay in the Great Plains States

There were over 337,700 clinical laboratory technicians and technologists at work in the U.S. as of May 2024 according to data published earlier this year by the U.S. Bureau of Labor Statistics (BLS).  The seven-state Great Plains region accounted for about 26,570 of those clinical lab tech jobs, or about 7.8% of U.S. clinical lab technician employment.  For clinical lab techs, the Great Plains region is one of the weakest ones in the nation for pay.  The clinical lab tech annual mean wage level in six of the seven states in the region fell below the national average, and four Great Plains states ranked among the ten worst states in the nation for clinical lab tech annual mean wages.  BLS data from May 2024 details the following about clinical lab tech pay in the Great Plains states:

Clinical Lab Tech Pay in the Great Plains States

State # Employed Annual Mean Wages Wage Rank*
IA 3,020 $57,110 43rd
KS 4,510 $61,770 30th
MN 6,010 $73,840 9th
MO 8,830 $60,210 33rd
NE 1,750 $63,270 25th
ND 1,160 $62,700 28th
SD 1,290 $58,220 40th
U.S. 337,740 $65,012 -------

(*) annual mean wage ranking among the 50 states

Source: U.S. Bureau of Labor Statistics OES. Data extracted on June 13, 2025

Thursday, June 12, 2025

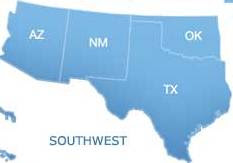
Nurse Practitioner Pay in the Southwestern U.S.

Data published earlier this summer by the U.S. Bureau of Labor Statistics (BLS) reports that there were over 303,000 nurse practitioners (NPs) working in the United States as of May 2024.  More than 34,000 nurse practitioner jobs in the U.S. were in the four-state Southwestern region of the country.  The Southwestern region is a relatively good one for nurse practitioner pay.  Nearly 90% of NPs in the Southwestern U.S. live in one of the three states in the region where NP annual mean wages exceed the national average of $130,077. A closer look at BLS data from May 2024 shows the following about nurse practitioner pay in the Southwestern U.S.:

Nurse Practitioner Pay in the Southwestern U.S.

Nurse Practitioner Pay in the Southwestern U.S.


State # Employed Annual Mean Wages Wage Rank*
AZ 7,540 $132,920 15th
NM 1,870 $136,620 11th
OK 3,020 $127,120 30th
TX 21,690 $130,930 19th
U.S. 303,410 $130,077 -------

(*) annual mean wage ranking among the 50 states and the District of Columbia

Source: U.S. Bureau of Labor Statistics OES. Data extracted on June 12, 2025

Thursday, June 5, 2025

Family Medicine Physician Pay in New England

According to recently published data from the U.S. Bureau of Labor Statistics (BLS), as of May 2024, there were just over 104,000 family medicine physicians employed across the United States. Of these, 6,120 were practicing in the six-state New England region.

BLS data highlights a significant pay disparity among family medicine physicians in New England. Massachusetts stands out, accounting for more than half of the region’s family medicine employment and ranking in the top 10 nationally for annual mean wages. In contrast, the other five New England states report average salaries below the national average.

The May 2024 BLS data provides the following insights into family medicine physician compensation across New England:

Family Medicine Physician Pay in New England

Family Medicine Physician Pay in New England

State # Employed Annual Mean Wages Wage Rank*
CT 900 $213,400 45th
MA 3,550 $301,270 4th
ME 630 $221,190 42nd
NH 410 $248,550 28th
RI 280 $244,270 30th
VT 350 $238,710 32nd
U.S. 104,780 $253,047 -------

(*) annual mean wage ranking among the 50 states and the District of Columbia

Source: U.S. Bureau of Labor Statistics OES. Data extracted on June 5, 2025

Tuesday, June 3, 2025

Speech Language Pathologist Pay in the Great Plains Region

The U.S. Bureau of Labor Statistics' (BLS) most current occupational employment data indicated that nearly 174,000 speech language pathologists (SLPs) were working in the United States as of May 2024.  More than 12,000 of those employed in the U.S. as SLPs resided in the seven-state Great Plains region.  BLS data indicated that the region is one of the weakest in the country for speech language pathologist pay, as no state in the region registered a SLP annual mean wage level above the national average.  Moreover, three Great Plains states ranked among the ten worst states in the country for SLP annual mean wages.  More examination of BLS data from May 2024 reveals the following details about speech language pathologist pay in the Great Plains region:

Speech Language Pathologist Pay in the Great Plains Region

State # Employed Annual Mean Wages Wage Rank*
IA 1,390 $85,230 32nd
KS 1,790 $84,230 36th
MN 3,730 $82,020 42nd
MO 2,700 $84,930 33rd
NE 1,230 $83,880 38th
ND 670 $73,950 48th
SD 510 $69,230 50th
U.S. 173,910 $91,089 -------

(*) annual mean wage ranking among the 50 states and the District of Columbia

Source: U.S. Bureau of Labor Statistics OES. Data extracted on June 3, 2025