Saturday, September 30, 2023

LPN Employment in the Great Plains Region

Recently released May 2022 employment data from the U.S. Bureau of Labor Statistics (BLS) reported that there were over 632,000 licensed practical nurses (LPNs) employed in the U.S.  Also known as licensed vocational nurses (LVNs) in some parts of the country, LPNs comprise one of the largest healthcare occupations in the country. Approximately 49,000 of those licensed practical nurse jobs were in the seven-state Great Plains region of the country. BLS data tells us that the Great Plains region is a weak one for licensed practical nurse pay, with annual mean wage levels in all states in the region falling below the national average for all LPNs.  Moreover, two states in the region, Missouri and South Dakota, were among the ten worst states in the nation for licensed practical nurse annual mean wage levels.  BLS data from May 2022 reveals the following about LPN employment in the Great Plains region of the U.S.:

LPN Employment in the Great Plains Region

LPN Employment in the Great Plains Region

State # Employed Annual Mean Wages Wage Rank*
IA 5,440 $51,400 39th
KS 6,820 $51,700 38th
MN 14,660 $54,870 26th
MO 12,110 $49,500 43rd
NE 5,570 $52,080 37th
ND 2,510 $53,080 30th
SD 2,120 $46,000 47th
U.S. 632,020 $55,860 -------

(*) annual mean wage ranking among the 50 states and the District of Columbia

Source: U.S. Bureau of Labor Statistics OES. Data extracted on September 24, 2023

Friday, September 29, 2023

Top Rehabilitation Hospitals in the Mid-Eastern U.S.

The 23-24 U.S. News & World Report hospital survey ranked in excess of 1,000 hospitals for their capabilities in delivering rehabilitation care to individuals recovering from severe injuries or illnesses.  The survey graded hospitals on various metrics ranging from rehabilitation care patient outcomes to the scale of a hospital's rehabilitation services to the level of recognition garnered by a hospital within the rehabilitation services community.  The Mid-Eastern U.S., a region that includes five states and the District of Columbia, was home to thirteen hospitals that rated among the 50 best U.S. hospitals for rehabilitation care in the 23-24 survey.  No other region of the country had as many top 50 rehabilitation hospitals as did the Mid-Eastern U.S.  This included four hospitals that ranked among the ten best hospitals in the U.S. for rehabilitation care.  The top rehabilitation hospitals in the Mid-Eastern U.S., and where they ranked nationally in the 23-24 U.S. News survey, were:

Top Rehabilitation Hospitals in the Mid-Eastern U.S

Top Rehabilitation Hospitals in the Mid-Eastern U.S

Location:  West Orange, NJ
National Rank:  #3 (See ranking details)

Location:  New York, NY
National Rank:  #5 (See ranking details)

Location:  Elkins Park, PA
National Rank:  #6 (See ranking details)

UPMC Mercy Rehabilitation
Location:  Pittsburgh, PA
National Rank:  #7 (See ranking details)


Location:  Washington, DC
National Rank:  #14 (See ranking details)

Location:  New York, NY
National Rank:  #18 (See ranking details)

Magee Rehabilitation Hospital - Jefferson Health
Location:  Philadelphia, PA
National Rank:  #23 (See ranking details)

Lancaster Rehabilitation Hospital
Location:  Lancaster, PA
National Rank:  #29 (See ranking details)

Burke Rehabilitation Hospital
Location:  White Plains, NY
National Rank:  #32 (See ranking details)

Location:  Schenectady, NY
National Rank:  #33 (See ranking details)

Location:  Edison, NJ
National Rank:  #41 (See ranking details)

Location:  Baltimore, MD
National Rank:  #43 (See ranking details)

For a more thorough look at the metrics used to score rehabilitation hospitals in the 23-24 U.S. News survey, or to find the rehabilitation care rating of other Mid-Eastern U.S. hospitals, visit Best Hospitals for Rehabilitation.

Thursday, September 28, 2023

Occupational Therapist Pay in New England

The most recently released U.S. Bureau of Labor Statistics (BLS) occupational employment data indicated that there were nearly 135,000 occupational therapists (OTs) employed in the U.S. as of May 2022. About 10,400 of those employed as occupational therapists lived in the six-state New England region of the country.  BLS data reveals New England to be a region of wide disparity in terms of OT pay, with only Connecticut having a mean annual wage level for occupational therapists that exceeded the profession's national average.  Concurrently, three states in the region (New Hampshire, Vermont, and Maine) ranked among the twelve worst states in the country for OT mean annual wage levels.  A closer review of May 2022 BLS data reveals the following details about occupational therapist pay in New England:

Occupational Therapist Pay in New England

Occupational Therapist Pay in New England

State # Employed Mean Annual Wage Wage Rank*
CT 2,250 $95,400 12th
MA 5,190 $91,840 18th
ME 1,110 $76,490 51st
NH 990 $83,930 41st
RI 590 $92,110 17th
VT 250 $81,710 47th
U.S. 134,980 $92,800 -------

(*) annual mean wage ranking among the 50 states and the District of Columbia

Source: U.S. Bureau of Labor Statistics OES. Data extracted on September 20, 2023

Wednesday, September 27, 2023

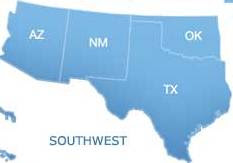
Dental Assistant Pay in the Southwestern U.S.

May 2022 data from the U.S. Bureau of Labor Statistics (BLS) reported dental assistant employment in the United States at more than 363,800.  The four-state Southwestern U.S. accounted for roughly 48,000 of those dental assistant jobs.  BLS data revealed the Southwestern U.S. to be a rather weak one for dental assistant pay, as no states in the region registered a mean annual wage level for dental assistants that was better than the profession's national average of $44,710.  Moreover, three states in the region ranked among the fifteen worst states in the nation for dental assistant mean annual wage levels. A deeper dive into May 2022 BLS data reveals the following details about dental assistant pay in the Southwestern U.S.:

Dental Assistant Pay in the Southwestern U.S.

Dental Assistant Pay in the Southwestern U.S.


State # Employed Mean Annual Wage Wage Rank*
AZ 9,040 $44,610 23rd
NM 2,040 $39,610 41st
OK 4,650 $40,770 38th
TX 32,360 $39,170 43rd
U.S. 363,880 $44,710 -------

(*) annual mean wage ranking among the 50 states and the District of Columbia

Source: U.S. Bureau of Labor Statistics OES. Data extracted on September 20, 2023

Tuesday, September 26, 2023

Top Rehabilitation Hospitals in the Far West

The 23-24 U.S. News & World Report hospital survey ranked more than 1,000 hospitals for their capabilities in delivering rehabilitation services to patients recovering from severe illnesses or injuries.  The survey ranked hospitals on various metrics related to the outcomes for their rehabilitation patients, the scale of their rehabilitation services, and the level of recognition garnered by a hospital from professionals within the rehabilitation care community.  Eight hospitals in the six-state Far West U.S. were rated among the top 50 U.S. hospitals for rehabilitation care in the 23-24 survey, including the University of Washington Medical Center, which was rated the eighth-best rehabilitation hospital in the nation.  The top rehabilitation hospitals in the Far West, and where they ranked nationally in the 23-24 U.S. News survey, were:

Top Rehabilitation Hospitals in the Far West

Top Rehabilitation Hospitals in the Far West

Location:  Seattle, WA
National Rank:  #8 (See ranking details)

California Rehabilitation Institute
Location:  Los Angeles
National Rank:  #21 (see ranking details)

Harborview Medical Center
Location:  Seattle, WA
National Rank:  #26 (See ranking details)

Location:  Downey, CA
National Rank:  #38 (See ranking details)

Location:  Portland, OR
National Rank:  #40 (See ranking details)

Location:  Vallejo, CA
National Rank:  #43 (See ranking details)

Keck Medical Center of USC
Location:  Los Angeles
National Rank:  #49 (see ranking details)

Location:  San Jose, CA
National Rank:  #50 (See ranking details)

For a more thorough look at the metrics used to score rehabilitation hospitals in the 23-24 U.S. News survey, or to find the rehabilitation care rating of other Far West hospitals, visit Best Hospitals for Rehabilitation.

Monday, September 25, 2023

Licensed Practical Nurse Pay in the Great Lakes Region

Recently published employment data from the U.S. Bureau of Labor Statistics (BLS) reported that, as of May 2022, there were more than 632,000 licensed practical nurses (LPNs) employed in the United States.  Also known as licensed vocational nurses (LVNs) in some parts of the country, licensed practical nurses make up one of the largest healthcare occupations in the U.S.  According to BLS data, approximately 83,900 of those licensed practical nursing jobs were in the five-state Great Lakes region of the country. A closer examination of BLS data from May 2022 reveals the following details about licensed practical nurse pay in the Great Lakes region of the U.S.:

Licensed Practical Nurse Pay in the Great Lakes Region


Licensed Practical Nurse Pay in the Great Lakes Region

State # Employed Mean Annual Wage Wage Rank*
IL 17,530 $58,840 16th
IN 11,990 $55,850 21st
MI 10,460 $57,180 19th
OH 37,310 $52,330 36th
WI 6,620 $52,610 34th
U.S. 632,020 $55,860 -------

(*) annual mean wage ranking among the 50 states and the District of Columbia

Source: U.S. Bureau of Labor Statistics OES. Data extracted on September 20, 2023

Sunday, September 24, 2023

Occupational Therapist Pay in the Great Plains Region

Recently released U.S. Bureau of Labor Statistics (BLS) data from May 2022 indicated that there were just under 135,000 occupational therapists (OTs) employed in the U.S.  About 10,100 of those employed as occupational therapists lived in the seven-state Great Plains region of the country.  BLS data reveals the Great Plains region to be a very weak one in terms of occupational therapist pay, with the OT mean annual wage level in all states in the region falling below the national average for the profession.  Moreover, four states in the region ranked among the ten worst states in the nation for OT mean annual wage levels.  A closer examination of the BLS data reveals the following about occupational therapist pay in the Great Plains region of the U.S. as of May 2022:

Occupational Therapist Pay in the Great Plains Region

Occupational Therapist Pay in the Great Plains Region

State # Employed Mean Annual Wage Wage Rank*
IA 1,240 $83,820 43rd
KS 1,310 $87,030 33rd
MN 2,850 $81,840 46th
MO 2,650 $85,780 36th
NE 1,150 $87,620 31st
ND 520 $78,020 49th
SD 410 $76,900 50th
U.S. 134,980 $92,800 -------

(*) annual mean wage ranking among the 50 states and the District of Columbia

Source: U.S. Bureau of Labor Statistics OES. Data extracted on September 18, 2023

Saturday, September 23, 2023

The Rocky Mountain Region's Top Rehabilitation Hospitals

The latest (23-24) U.S. News & World Report survey of American hospitals graded over 1,000 hospitals for their capabilities in delivering rehabilitation services to patients recovering from severe illnesses or injuries.  The study graded these hospitals on multiple metrics related to the medical outcomes for their rehabilitation patients, the scale and scope of their rehabilitation programs, and the level of professional recognition a hospital received from the wider rehabilitation care community.  Two hospitals in the five-state Rocky Mountain ranked among the 50 best U.S. hospitals for rehabilitation care in the 23-24 survey.  The Rocky Mountain region's top rehabilitation hospitals, and where they ranked for rehabilitation care nationally in the 23-24 USNWR survey, were:

The Rocky Mountain Region's Top Rehabilitation Hospitals

The Rocky Mountain Region's Top Rehabilitation Hospitals


Location:  Englewood, CO
National Rank:  #16 (See ranking details)

Location:  Salt Lake City, UT
National Rank:  #47 (See ranking details)

For a deeper examination of the metrics used to grade rehabilitation hospitals in the 23-24 U.S. News survey, or to find the rehabilitation care rating of other Rocky Mountain region hospitals, visit Best Hospitals for Rehabilitation.

Friday, September 22, 2023

Physician Assistant Employment in New England

Recently published data from the U.S. Bureau of Labor Statistics (BLS) indicates that, as of May 2022, there were just under 141,000 physician assistants (PAs) employed in the U.S.  More than 8,500 of those jobs were in the six-state New England region.  BLS data reveals New England as one of the better-paying regions of the country for physician assistants.  The mean annual wage for PAs is above the national average in every state in the region.  Moreover, the median annual wage, the wage level that divides the top and lower half of earners on the wage scale, is also above the national average in every state in the region.  A closer look at BLS data from May 2022 reveals the following state-level details about physician assistant employment in New England:

Physician Assistant Employment in New England


Physician Assistant Employment in New England

State # Employed Mean Annual Wage Median Annual Wage
CT 2,820 $143,280 $135,310
MA 3,300 $131,920 $132,210
ME 770 $126,630 $126,930
NH 940 $136,200 $132,280
RI 390 $128,660 $128,170
VT 330 $132,860 $127,650
U.S. 140,910 $125,270 $126,010

Source: U.S. Bureau of Labor Statistics OES. Data extracted on September 17, 2023

Thursday, September 21, 2023

Dental Assistant Pay in the Mid-East Region

Newly released May 2022 employment data from the U.S. Bureau of Labor Statistics (BLS) indicated that there were more than 363,800 dental assistants employed in the United States.  Roughly 46,000 of those employed as dental assistants lived in the Mid-East region of the country, a region that includes the District of Columbia and five states.  BLS data reveals the Mid-East region to be a relatively good one for dental assistant pay, with all states in the region registering a mean annual wage for dental assistants that topped the national average for the profession.  A closer look at May 2022 BLS data reveals the following about dental assistant pay in the Mid-East region of the U.S.:

Dental Assistant Pay in the Mid-East Region


Dental Assistant Pay in the Mid-East Region

State # Employed Mean Annual Wage Wage Rank*
DC 660 $52,820 2nd
DE 900 $52,500 3rd
MD 5,040 $45,060 20th
NJ 9,500 $46,410 16th
NY 19,040 $47,880 13th
PA 10,890 $44,740 22nd
U.S. 363,880 $44,710 -------

(*) annual mean wage ranking among the 50 states and the District of Columbia

Source: U.S. Bureau of Labor Statistics OES. Data extracted on September 18, 2023

Wednesday, September 20, 2023

New England's Top Rehabilitation Hospital

The 23-24 U.S. News & World Report survey of American hospitals graded more than 1,000 hospitals for their capabilities to provide rehabilitation services to patients recovering from severe illnesses or injuries.  The study graded hospitals on multiple metrics related to the outcomes for their rehabilitation patients, the scale of their rehabilitation programs, and the amount of recognition garnered by a hospital from within the rehabilitation care community.  Only one hospital, Spaulding Rehabilitation Hospital, in the six-state New England region graded out as a top 50 rehabilitation hospital in the 23-24 U.S. News survey.  That said, Spaulding is one of the preeminent rehabilitation hospitals in the nation, grading out in the survey as the 2nd best hospital in the country for rehabilitation care:

New England's Top Rehabilitation Hospital


New England's Top Rehabilitation Hospital

Location:  Boston, MA
National Rank:  #2 (See ranking details)

For a closer look at the metrics used to score rehabilitation hospitals in the 23-24 U.S. News survey, or to find the rehabilitation care rating of other New England hospitals, visit Best Hospitals for Rehabilitation.

Tuesday, September 19, 2023

Chiropractor Pay in the Southeast

According to the most current occupational employment data released by the U.S. Bureau of Labor Statistics (BLS), there were over 37,700 chiropractors working in the United States as of May 2022.  As of that time, the twelve-state Southeast region of the country was home to over 10,300 employed chiropractors.  For chiropractors, pay levels in the region varied sharply from state to state.  BLS data shows only five Southeastern states having a median annual wage for chiropractors in excess of the national average as of May 2022 - the median wage being the mid-point on the wage scale that divides the upper and lower half of wage-earners.  However, those five states accounted for about 63% of the chiropractors in the region.  While chiropractor wage levels were good in some states, at the other end of the spectrum there were five other Southeastern states where the median annual wage for chiropractors was more than 10% below the national average.  Taking a deeper dive into May 2022 BLS data reveals the following details about chiropractor pay in the Southeast U.S.:

Chiropractor Pay in the Southeast

Chiropractor Pay in the Southeast

State # Employed Mean Annual Wage Median Annual Wage
AL 410 $73,760 $66,370
AR 300 $100,160 $77,480
FL 3,050 $88,040 $79,720
GA 2,280 $85,270 $86,380
KY 460 $89,660 $72,580
LA 370 $70,880 $63,960
MS 150 $74,950 $59,720
NC 870 $92,720 $79,470
SC 620 $67,990 $63,980
TN 680 $64,030 $62,220
VA 1,060 $73,630 $62,040
WV 80 $97,610 $77,380
U.S. 37,740 $83,720 $75,380

Source: U.S. Bureau of Labor Statistics OES. Data extracted on September 17, 2023

Monday, September 18, 2023

Health Services Management Pay in the Great Lakes Region

The United States held more than 476,000 health service management jobs as of May 2022 according to data published earlier this year by the U.S. Bureau of Labor Statistics (BLS).  As of May 2022, over 63,000 were employed as health services managers in the five-state Great Lakes region.  BLS data revealed much disparity in the region for health services manager pay.  On the one hand, about one-third of the region's health service managers were employed in Illinois or Wisconsin, two states where the profession's median annual wage topped the national average of $104,830.  However, most health services managers in the region lived in a state where the median annual wage was at least 4.5% below the national norm.  A deeper dive into May 2022 BLS data revealed the following details about health services management pay in the Great Lakes region:

Health Services Management Pay in the Great Lakes Region

Health Services Management Pay in the Great Lakes Region

State # Employed Median Annual Wage Mean Annual Wage
IL 16,040 $105,940 $130,670
IN 10,410 $96,460 $105,610
MI 13,750 $100,090 $116,790
OH 18,000 $99,890 $114,110
WI 4,980 $110,010 $141,140
U.S. 476,750 $104,830 $127,980

Source: U.S. Bureau of Labor Statistics OES. Data extracted on September 17, 2023

Sunday, September 17, 2023

The Southwest's Top Rehabilitation Hospitals

The 23-24 U.S. News & World Report survey of American hospitals rated over 1,000 hospitals for their proficiency and effectiveness in delivering rehabilitation services to patients recovering from severe injuries or illnesses.  The study rated hospitals on various metrics related to the outcomes for their rehabilitation care patients, the scale of their rehabilitation services and programs, and the amount of professional recognition garnered by a hospital from within the rehabilitation care community.  Six hospitals in the U.S. Southwest rated among the top 50 U.S. hospitals for rehabilitation care in the 23-24 survey, including TIRR Memorial Hermann in Houston, which was rated the fourth-best rehabilitation hospital in the nation.  The Southwest's top rehabilitation hospitals, and where they ranked nationally for rehabilitation care in the 23-24 U.S. News survey, were:

The Southwest's Top Rehabilitation Hospitals

The Southwest's Top Rehabilitation Hospitals

Location:  Houston, TX
National Rank:  #4 (See ranking details)

Location:  Dallas, TX
National Rank:  #15 (See ranking details)


St. David's Rehabilitation Hospital
Location:  Austin, TX
National Rank:  #25 (See ranking details)

Location:  Phoenix, AZ
National Rank:  #37 (See ranking details)

Location:  Phoenix, AZ
National Rank:  #48 (See ranking details)

For a deeper look at the metrics used to score rehabilitation hospitals in the 23-24 U.S. News survey, or to find the rehabilitation care rating of other Southwestern hospitals, visit Best Hospitals for Rehabilitation.

Wednesday, September 13, 2023

Physician Assistant Pay in the Great Plains Region

Data published recently by the U.S. Bureau of Labor Statistics (BLS) put physician assistant (PA) employment in the U.S. at nearly 141,000 as of May 2022.  The Great Plains region of the country was home to just over 8,900 of those physician assistants according to the BLS data.  BLS data revealed physician assistant pay levels in the region to be generally lower than national averages.  Only Minnesota had a PA mean annual wage level that topped the national average.  And no Great Plains state had a PA median annual wage, which is the mid-point on the wage scale between the upper and lower halves of wage earners, that exceeded the national average of $126,010.  A closer examination of BLS data from May 2022 details the following about physician assistant pay in the Great Plains region:

Physician Assistant Pay in the Great Plains Region

Physician Assistant Pay in the Great Plains Region

State # Employed Mean Annual Wage Median Annual Wage
IA 1,140 $123,490 $125,240
KS 870 $114,470 $108,090
MN 3,530 $125,680 $124,440
MO 1,100 $111,610 $109,540
NE 1,410 $120,740 $120,260
ND 310 $122,590 $125,750
SD 570 $119,010 $122,550
U.S. 140,910 $125,270 $126,010

Source: U.S. Bureau of Labor Statistics OES. Data extracted on September 10, 2023

Tuesday, September 12, 2023

Chiropractor Pay in the Southwestern U.S.

According to the most recent occupational employment data published by the U.S. Bureau of Labor Statistics (BLS), as of May 2022, just over 37,700 chiropractors were employed in the United States.  About 3,600 of those employed as chiropractors lived in the four-state Southwestern U.S.  For chiropractors, pay levels in the Southwest were good in Texas, but weak elsewhere in the region.  In Texas, the mean and median annual wage levels for chiropractors exceeded the national averages.  However, about 35% of the region's chiropractors lived in Arizona, New Mexico, and Oklahoma, all three of which had chiropractor mean and median wage levels that were at least 10% below the national average.  Further examination of BLS data from May 2022 reveals the following details about chiropractor pay in the Southwestern U.S.:

Chiropractor Pay in the Southwestern U.S.

Chiropractor Pay in the Southwestern U.S.


State # Employed Mean Annual Wage Median Annual Wage
AZ 660 $71,650 $63,800
NM 170 $72,500 $66,430
OK 430 $71,500 $47,850
TX 2,340 $88,000 $78,000
U.S. 37,740 $83,720 $75,380

Source: U.S. Bureau of Labor Statistics OES. Data extracted on September 10, 2023

Monday, September 11, 2023

Our Multi-Billion Dollar Medical Fraud Problem

The Multi-Billion Dollar Medical Fraud Problem in the United States

We have a multi-billion dollar medical fraud problem in the U.S. and it's costing Americans somewhere between $68 billion and $300 billion each year according to the experts. That means that fraudsters and charlatans are pilfering from our healthcare system the equivalent of between $200 and $900 a year, every year, from every man, woman, and child in the United States.  Of course, Americans who use healthcare services infrequently probably aren't even aware of what's happening.  They can rest assured, however, that medical fraud is costing them in the form of higher health insurance premiums, increased tax burdens, and added out-of-pocket costs when they do have to use healthcare services.  And if financial harm for patients and taxpayers isn't bad enough, medical fraud can also expose Americans to personal harm from medically unnecessary tests, procedures, or medications.

The most common type of medical fraud involves providing tests, procedures, or medications that are not medically necessary. Other common types of medical fraud include (1) billing for services that were not rendered, (2) billing for a more expensive service than the one actually performed (a practice known as "upcoding"), (3) kickbacks payments made to doctors or other healthcare providers in exchange for referring patients or ordering certain tests or procedures, and (4) submitting claims with fraudulent information to a healthcare payer.

Medical fraud is a complex problem for the U.S. healthcare system and there are ongoing public and private initiatives to combat it. Such efforts include:

  • Enhanced oversight and enforcement by government agencies
  • Better education and training for healthcare providers
  • Improved data analytics to identify patterns of fraud
  • Whistleblower programs that reward individuals who report fraud

If you suspect medical fraud, do not hesitate to report it to the U.S. Department of Justice or your state's attorney general's office. You can also report it using the resources available from the National Health Care Anti-Fraud Association (NHCAA).

References:

(1) The Challenge of Health Care Fraud: by the National Health Care Anti-Fraud Association
(2) Health Care Fraud | United States Sentencing Commission
(3) Inside the mind of criminals: How to brazenly steal $100 billion from Medicare and Medicaid
(4) Health Care Fraud - FBI

Sunday, September 10, 2023

Health Services Management Pay in the U.S. Mid-East Region

There were more than 476,000 health service management jobs in the U.S. as of May 2022 according to data published recently by the U.S. Bureau of Labor Statistics (BLS).  As of May 2022, nearly 76,000 were employed as health services managers in the U.S. Mid-East region, an area that encompasses five states and the District of Columbia.  On a relative basis, health service management jobs in the U.S. Mid-East region paid better than in most other regions of the country.  In every state in the region, except for Pennsylvania, both the mean and median annual wage for health services managers exceed the national average for the profession.  A review of May 2022 BLS data details the following about health services management pay in the U.S. Mid-East region:

Health Services Management Pay in the U.S. Mid-East Region

Health Services Management Pay in the U.S. Mid-East Region

State # Employed Median Annual Wage Mean Annual Wage
DC 1,790 $133,050 $156,870
DE 1,270 $127,950 $150,840
MD 12,530 $127,390 $148,650
NJ 16,490 $127,760 $153,300
NY 25,430 $138,010 $171,620
PA 18,310 $103,790 $120,910
U.S. 476,750 $104,830 $127,980

Source: U.S. Bureau of Labor Statistics OES. Data extracted on September 9, 2023

Saturday, September 9, 2023

Physician Assistant Pay in the Southeastern U.S.

The U.S. Bureau of Labor Statistics (BLS) most recent occupational employment data put physician assistant (PA) employment in the U.S. at just under 141,000 as of May 2022.  The twelve-state Southeastern U.S. was home to almost 34,000 of those physician assistants according to the BLS data.  BLS data revealed the region to be among the worst in the nation for physician assistant pay levels.  The mean annual wage for physician assistants failed to top the national average in any Southeastern state.  Moreover, the profession's median annual wage, which is the point on the wage scale that separates the top and bottom half of wage earners, was below the national average of $126,010 in every Southeastern state.  A further examination of BLS data from May 2022 revealed the following about physician assistant pay in the Southeastern U.S.:

Physician Assistant Pay in the Southeastern U.S.

Physician Assistant Pay in the Southeastern U.S.

State # Employed Mean Annual Wage Median Annual Wage
AL 760 $94,220 $91,580
AR 840 $68,270 $49,780
FL 8,480 $110,930 $109,160
GA 4,950 $113,260 $108,490
KY 1,150 $105,980 $105,840
LA 1,830 $119,600 $115,400
MS 360 $77,290 $58,910
NC 7,150 $119,830 $121,980
SC 1,730 $106,200 $104,260
TN 1,980 $106,110 $104,400
VA 4,230 $118,920 $119,440
WV 530 $114,260 $109,100
U.S. 140,910 $125,270 $126,010

Source: U.S. Bureau of Labor Statistics OES. Data extracted on September 9, 2023