Tuesday, November 30, 2021

Children's Hospital of Philadelphia, Our Trusted Link for November 2021


Children's Hospital of Philadelphia

In 1855, the Children's Hospital of Philadelphia (CHOP) became the first hospital in the U.S. dedicated exclusively to the treatment of children. Now it's a worldwide leader in pediatric research, focused on translating research into pediatric care. 

In the U.S. News Hospital Ranking, CHOP is the nation's #2 children's hospital and #1 in the nation for pediatric treatment of cancer, diabetes, and orthopedics. In 1877, CHOP offered the first formal pediatrics training in the U.S. In 1919, it affiliated with the University of Pennsylvania School of Medicine (now Perelman). The CHOP Research Institute employs thousands of scientists working in four areas: 

  • rare and complex diseases
  • novel therapeutics and devices
  • precision (individualized) health
  • "lifespan research" which studies the fetal to adult health continuum.

Milestones

1872 - Children's Seashore House was opened to provide rehabilitative care for children. 

1914 - The nation's first Department for the Prevention of Disease was established. 

1923 - First whooping cough vaccine developed. Later vaccines were developed for mumps, influenza and rotavirus.

1937 - First closed incubator of newborns was used. 

1962 - Nation's first neonatal intensive care unit (NICU) was opened by then surgeon-in-chief Dr. C. Everett Koop. 

1974 - The first Ronald McDonald House opened for parents traveling to obtain medical services for a child. 

Vaccine Education Center

Launched in 2000, the VEC produces and distributes accurate, comprehensive and up-to-date information about vaccines and the diseases they prevent. In addition to an enormous and well-organized web site, the Center sends out speakers, performs webinars, distributes newsletters, videos, brochures, and flyers. For educating children and teens, they have created two games, Vax Pack Hero and "Just the Vax" trivia contest

CHOP Publications

For Professionals:

Play Vax Pack Hero

Recreational Therapist Pay in the Rocky Mountain Region

The U.S. Bureau of Labor Statistics (BLS) released data earlier this year that reported over 20,000 recreational therapists employed in the United States as of May 2020.  Just over 800 of the nation's recreational therapists were employed in the five-state Rocky Mountain region according to the BLS.  Relative to the rest of the country, BLS data shows the region to be a weak one for recreational therapist pay, with no states in the region having an annual mean wage for recreational therapists that was better than the national average.  A closer study of May 2020 BLS data details the following about recreational therapist pay in the Rocky Mountain region:

Recreational Therapist Pay in the Rocky Mountain Region

Recreational Therapist Pay in the Rocky Mountain Region


State # Employed Annual Mean Wages Wage Rank*
CO 340 $46,590 34th
ID 70 $43,870 40th
MT 30 $48,530 23rd
UT 350 $46,290 36th
WY 30 $51,040 13th
U.S. 20,080 $51,260 -------

(*) annual mean wage ranking among the 50 states and the District of Columbia

Source: U.S. Bureau of Labor Statistics OES. Data extracted on May 29, 2021

Monday, November 29, 2021

Physical Therapy Assistant Pay in the Southeast

Recently published data from the U.S. Bureau of Labor Statistics (BLS) put the number of employed physical therapy (PT) assistants at close to 93,000 as of May 2020.  Approximately 27,500 physical therapy assistants were employed in the twelve-state Southeastern U.S. at that time. BLS data shows the Southeast to be a modestly subpar region for physical therapy assistant pay.  Although Florida rated as one of the ten best states in the nation for PT assistant annual mean wages, and two other Southeast states ranked in the top 15 nationally, most Southeastern states registered PT assistant annual mean wage levels below the national average. About 59% of the Southeast's PT assistants lived in a state with an annual mean wage level for the profession that was below the national average.  A further review of BLS data from May 2020 renders the following details about physical therapy assistant pay in the Southeast:

Physical Therapy Assistant Pay in the Southeast

State # Employed Annual Mean Wages Wage Rank*
AL 1,620 $58,430 21st
AR 1,420 $60,080 15th
FL 7,100 $62,960 7th
GA 2,590 $56,920 27th
KY 1,520 $55,120 34th
LA 1,470 $56,810 29th
MS 850 $50,120 45th
NC 2,640 $61,020 12th
SC 1,450 $59,410 16th
TN 3,060 $57,790 24th
VA 2,960 $58,960 20th
WV 840 $54,930 35th
U.S. 92,740 $59,440 -------

(*) annual mean wage ranking among the 50 states and the District of Columbia

Source: U.S. Bureau of Labor Statistics OES. Data extracted on May 29, 2021

Sunday, November 28, 2021

U.S. Heart Disease Deaths by Region

Heart disease is the leading cause of death in the United States. In 2019, it accounted for more than 659,000 deaths, or about 23% of all deaths in the U.S. that year.  The incidence of death by heart disease dropped considerably between 1999 and 2019, thanks to improved medical knowledge and know-how.  From 259.9 deaths per 100,000 population in 1999, by 2019 the rate had dropped to 200.8 deaths per 100,000 population.  That said, the heart disease death rate nationally has been creeping higher during the past decade.  On a regional basis, similar trends in the heart disease death rate are evident.   Further examination of data from the Centers for Disease Control and Prevention, National Center for Health Statistics, yielded the following details about U.S. heart disease deaths by region (to see state level data, follow the "Area" links in the table below):

Area/Deaths 1999 2009 2019
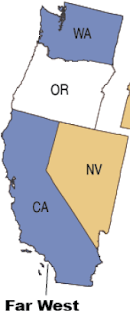
Far West 97,912 83,793 91,594
Great Lakes 124,760 97,826 107,193
Great Plains 51,535 39,872 43,892
Mid-East 139,930 111,960 109,831
New England 35,517 27,951 28,534
Rocky Mountain 14,796 14,100 18,062
Southeast 191,809 163,145 186,004
Southwest 68,933 60,766 73,931
Total 725,192 599,413 659,041
Area/Death Rate* 1999 2009 2019
Far West 210.5 160.6 161.9
Great Lakes 277.4 211.0 228.5
Great Plains 269.4 195.5 204.8
Mid-East 303.5 233.5 224.8
New England 256.7 194.1 192.2
Rocky Mountain 162.7 130.6 145.7
Southeast 279.7 209.7 219.1
Southwest 223.6 164.7 174.7
Total 259.9 195.4 200.8

(*) number of heart disease deaths per 100,000 population

Source: CDC Wonder. Centers for Disease Control and Prevention, National Center for Health Statistics. Underlying Cause of Death 1999-2019 on CDC WONDER Online Database, released in 2020. Data are from the Multiple Cause of Death Files, 1999-2019, as compiled from data provided by the 57 vital statistics jurisdictions through the Vital Statistics Cooperative Program. Accessed on June 5, 2021

Friday, November 26, 2021

Radiologic Tech Pay in the Far Western U.S.

Data released earlier this year by the U.S. Bureau of Labor Statistics (BLS) estimated that, as of May 2020, close to 207,000 radiologic technicians and technologists were employed in the United States.  The six-state Far Western U.S. held nearly 25,000 of those radiologic technologist and technician jobs.  BLS data revealed the region to be the best in the nation for radiologic tech pay.  The Far Western U.S. was home to five states that ranked among the ten best in the nation for radiologic tech annual mean wages. And Nevada, the only Far Western state that did not make the top ten, ranked 11th nationally. Further examination of May 2020 data from the BLS provided the following data about radiologic tech pay in Far Western U.S.:

Radiologic Tech Pay in the Far Western U.S.

Radiologic Tech Pay in the Far Western U.S.

State # Employed Annual Mean Wages Wage Rank*
AK 370 $79,330 4th
CA 16,670 $95,010 1st
HI 620 $82,990 2nd
NV 1,230 $71,630 11th
OR 2,050 $76,520 7th
WA 3,920 $77,310 6th
U.S. 206,720 $64,840 -------

(*) annual mean wage ranking among the 50 states and the District of Columbia

Source: U.S. Bureau of Labor Statistics OES. Data extracted on May 26, 2021

Thursday, November 25, 2021

Clinical Lab Tech Pay in the Great Lakes Region

The U.S. Bureau of Labor Statistics (BLS) published data recently that put clinical laboratory technician and technologist employment at over 326,000 as of May 2020.  Just over 53,200 clinical lab tech positions were in the five-state Great Lakes region at that time.  For clinical lab techs, the Great Lakes region was a subpar one in terms of pay relative to the national average.  More than 85% of clinical lab techs in the region lived in one of the four Great Lakes region states where the annual mean wage for clinical lab techs lagged the national average. A closer review of BLS data from May 2020 yielded the following details about clinical lab tech pay in the Great Lakes region:

Clinical Lab Tech Pay in the Great Lakes Region

Clinical Lab Tech Pay in the Great Lakes Region

State # Employed Annual Mean Wages Wage Rank*
IL 14,630 $52,720 31st
IN 7,730 $48,410 48th
MI 11,590 $52,720 32nd
OH 11,830 $53,730 28th
WI 7,460 $56,020 20th
U.S. 326,220 $55,990 -------

(*) annual mean wage ranking among the 50 states

Source: U.S. Bureau of Labor Statistics OES. Data extracted on May 18, 2021

Wednesday, November 24, 2021

U.S. Drug Induced Deaths by Region

In 2019, over 74,500 drug induced deaths were recorded in the United States, or about 22.7 deaths per 100,000 population.  About 95% of these fatalities stemmed from drug overdoses, both accidental and intentional.  Nationally, from 1999 to 2019 the annual drug induced death count increased by over 50,000 and the drug induced death rate per 100,000 population more than tripled. While every region of the country experienced an increase in its annual drug induced death count over the twenty years from 1999 to 2019, five regions of the country experienced a worse trend than the nation as whole.  In fact, the drug induced death rate per 100,000 population more than quadrupled from 1999 to 2019 in the New England, Southeastern, Great Lakes, and Great Plains regions.  A closer study of data from the Centers for Disease Control and Prevention, National Center for Health Statistics, produced the following details about U.S. drug induced deaths by region (to see state level data, follow the "Area" links in the table below) :

Area/Deaths 1999 2009 2019
Far West 4,391 6,733 9,950
Great Lakes 2,602 6,087 12,833
Great Plains 698 2,050 3,704
Mid-East 3,678 5,088 14,338
New England 1,066 1,892 4,840
Rocky Mountain 722 1,683 2,246
Southeast 3,700 10,851 19,917
Southwest 2,271 4,763 6,683
Total 19,128 39,147 74,511
Area/Death Rate* 1999 2009 2019
Far West 9.4 12.9 17.6
Great Lakes 5.8 13.1 27.4
Great Plains 3.6 10.1 17.3
Mid-East 8.0 10.6 29.3
New England 7.7 13.1 32.6
Rocky Mountain 7.9 15.6 18.1
Southeast 5.4 13.9 23.5
Southwest 7.4 12.9 15.8
Total 6.9 12.8 22.7

(*) number of drug induced deaths per 100,000 population

Source: CDC Wonder. Centers for Disease Control and Prevention, National Center for Health Statistics. Underlying Cause of Death 1999-2019 on CDC WONDER Online Database, released in 2020. Data are from the Multiple Cause of Death Files, 1999-2019, as compiled from data provided by the 57 vital statistics jurisdictions through the Vital Statistics Cooperative Program. Accessed on June 5, 2021

Sunday, November 21, 2021

Nurse Practitioner Pay in New England

May 2020 data released earlier this year by the U.S. Bureau of Labor Statistics (BLS) put nurse practitioner (NP) employment in the United States at more than 211,000.  The six-state New England region held more than 12,600 nurse practitioner jobs at that time.  BLS data indicated New England to be a moderately good one for nurse practitioner pay, despite the fact that three states in the region had a NP annual mean wage level that was below the national average. The other three states in the region, all of whom had NP annual mean wage levels higher than the national average, were home to three-quarters of the region's NPs. Moreover, half the NPs in the region lived in Massachusetts, a state that ranked among the ten best states in the country for nurse practitioner annual mean wages. A closer examination of BLS data from May 2020 shows the following about nurse practitioner pay in New England:

Nurse Practitioner Pay in New England

Nurse Practitioner Pay in New England

State # Employed Annual Mean Wages Wage Rank*
CT 2,630 $116,780 14th
MA 6,430 $126,050 5th
ME 1,360 $111,580 27th
NH 1,060 $112,460 23rd
RI 690 $117,300 12th
VT 460 $108,280 37th
U.S. 211,280 $114,510 -------

(*) annual mean wage ranking among the 50 states and the District of Columbia

Source: U.S. Bureau of Labor Statistics OES. Data extracted on May 17, 2021

Saturday, November 20, 2021

U.S. Firearm Deaths by Region

There were more than 39,700 firearm deaths in the United States in 2019.  The national firearm death rate in 2019, at 12.1 firearm deaths per 100,000 population, was 17% higher than in 1999.  Every region of the country, except for the Far West, likewise experienced an increase in its firearm death rate during this time period.  Moreover, other than the Far West and Mid-East regions, every region's firearm death rate increased more than the national average.  This included three regions (Great Lakes, Great Plains and Rocky Mountain) where the firearm death rate in 2019 was more than 25% higher than in 1999.  Further examination of data from the Centers for Disease Control and Prevention, National Center for Health Statistics, reveals the following details about U.S. firearm deaths by region (to see state level data, follow the "Area" links in the table below) :

Area/Deaths 1999 2009 2019
Far West 4,533 4,691 5,084
Great Lakes 4,361 4,336 5,727
Great Plains 1,746 1,920 2,825
Mid-East 3,460 3,491 3,704
New England 691 707 871
Rocky Mountain 992 1,301 1,837
Southeast 9,353 10,522 13,632
Southwest 3,738 4,379 6,027
Total 28,874 31,347 39,707
Area/Death Rate* 1999 2009 2019
Far West 9.7 9.0 9.0
Great Lakes 9.7 9.4 12.2
Great Plains 9.1 9.4 13.2
Mid-East 7.5 7.3 7.6
New England 5.0 4.9 5.9
Rocky Mountain 10.9 12.1 14.8
Southeast 13.6 13.5 16.1
Southwest 12.1 11.9 14.2
Total 10.3 10.2 12.1

(*) number of firearm-caused deaths per 100,000 population; death count includes both intentional and unintentional fatalities caused by a firearm

Source: CDC Wonder. Centers for Disease Control and Prevention, National Center for Health Statistics. Underlying Cause of Death 1999-2019 on CDC WONDER Online Database, released in 2020. Data are from the Multiple Cause of Death Files, 1999-2019, as compiled from data provided by the 57 vital statistics jurisdictions through the Vital Statistics Cooperative Program. Accessed on June 2, 2021

Friday, November 19, 2021

Rocky Mountain Region Dental Hygienist Pay

Earlier this year the U.S. Bureau of Labor Statistics (BLS) reported nearly 195,000 dental hygienists at work in the United States as of May 2020.  The five-state Rocky Mountain region accounted for 9,500 dental hygienist jobs according to the BLS data.  Outside of Colorado, which was ranked among the ten best states in the country for dental hygienist annual mean wages, the region was a relatively weak one for dental hygienist pay. All dental hygienists in the region, outside of Colorado, lived in states where the dental hygienist annual mean wage level was below the national average. A closer review of May 2020 BLS data revealed the following details about Rocky Mountain region dental hygienist pay:

Rocky Mountain Region Dental Hygienist Pay

Rocky Mountain Region Dental Hygienist Pay


State # Employed Annual Mean Wages Wage Rank*
CO 3,650 $87,140 8th
ID 1,760 $76,670 22nd
MT 760 $77,010 19th
UT 2,800 $69,050 38th
WY 530 $66,280 44th
U.S. 194,830 $78,050 -------

(*) annual mean wage ranking among the 50 states and the District of Columbia

Source: U.S. Bureau of Labor Statistics OES. Data extracted on May 17, 2021

Wednesday, November 17, 2021

Medical Assistant Pay in the Southwestern U.S.

U.S. Bureau of Labor Statistics (BLS) data published this past spring showed just over 710,000 medical assistants (MAs) at work in the United States as of May 2020.  The four-state Southwestern U.S. held over 108,000 of those MA jobs.  BLS data shows the Southwest to be one of the weakest ones in the country for medical assistant pay, as no state in the region registered a MA annual mean wage level that topped the national average for medical assistants.  In fact, three states in the region ranked among the fifteen worst states in the nation for medical assistant annual mean wages.  BLS data reveals the following detail about medical assistant pay in the Southwestern U.S. as of May 2020:

Medical Assistant Pay in the Southwestern U.S.

Medical Assistant Pay in the Southwestern U.S.


State # Employed Annual Mean Wages Wage Rank*
AZ 19,460 $35,670 27th
NM 7,230 $32,340 43rd
OK 8,960 $31,790 46th
TX 72,640 $33,700 39th
U.S. 710,200 $36,930 -------

(*) annual mean wage ranking among the 50 states and the District of Columbia

Source: U.S. Bureau of Labor Statistics OES. Data extracted on May 15, 2021

Tuesday, November 16, 2021

Cancer Deaths in the Great Lakes Region

The second leading cause of death in America, cancer accounted for over 599,000 deaths in 2019, or 21% of all deaths in the United States that year.  Thanks to improvements in medical knowledge, the cancer death rate dropped modestly from its 1999 level of 197.0 deaths per 100,000 population to 182.7 deaths per 100,000 population by 2019.  The Great Lakes region also witnessed a drop in its cancer death rate during this period, but to a lesser degree than the nation as a whole.  Already a region with a cancer death rate 5.7% higher the national average in 1999, by 2019 its cancer death rate of 202.6 deaths per 100,000 population was 10.9% above the national average.  As of 2019, the Great Lakes region had the highest cancer death rate of any region of the country.  A deeper examination of data from the Centers for Disease Control and Prevention, National Center for Health Statistics, produced the following details about cancer deaths in the Great Lakes region:

Cancer Deaths in the Great Lakes Region

Cancer Deaths in the Great Lakes Region

Area/Deaths 1999 2009 2019
IL 25,024 24,185 23,902
IN 12,898 13,093 13,515
MI 19,744 20,257 20,923
OH 25,233 25,149 25,170
WI 10,755 10,866 11,505
Region 93,654 93,550 95,015
U.S. 549,838 567,628 599,601
Area/Death Rate* 1999 2009 2019
IL 202.5 189.0 188.6
IN 213.4 202.7 200.8
MI 199.5 204.6 209.5
OH 222.6 218.1 215.3
WI 201.7 191.7 197.6
Region 208.3 201.8 202.6
U.S. 197.0 185.0 182.7

(*) number of cancer deaths per 100,000 population

Source: CDC Wonder. Centers for Disease Control and Prevention, National Center for Health Statistics. Underlying Cause of Death 1999-2019 on CDC WONDER Online Database, released in 2020. Data are from the Multiple Cause of Death Files, 1999-2019, as compiled from data provided by the 57 vital statistics jurisdictions through the Vital Statistics Cooperative Program. Accessed on June 12, 2021

Monday, November 15, 2021

Family Medicine Physician Pay in the Far West

Recently released data from the U.S. Bureau of Labor Statistics (BLS) put family medicine physician employment in the United States at just over 98,500 as of May 2020.  More than 14,300 family medicine physicians were working in the six-state Far West region.  A look at BLS data reveals wide pay disparity for Far West region family medicine physicians.  At least 80% of family medicine physicians in the region lived in a state where the annual mean wage for the profession was near, or slightly lower than, the national average for the family medicine physicians.  At the same time, however, three states in the region ranked among the six best states nationally for family medicine physician annual mean wages.  More examination of May 2020 data from the BLS yields the following details about family medicine physician pay in the Far West region:

Family Medicine Physician Pay in the Far West

Family Medicine Physician Pay in the Far West

State # Employed Annual Mean Wages Wage Rank*
AK 420 $264,010 1st
CA 10,920 $215,860 27th
HI 350 $251,180 4th
NV 630 $205,040 38th
OR 860 N/A N/R
WA 1,150 $245,360 6th
U.S. 98,590 $214,370 -------

(*) annual mean wage ranking among the 50 states and the District of Columbia

Source: U.S. Bureau of Labor Statistics OES. Data extracted on May 12, 2021

Sunday, November 14, 2021

General Dentist Pay in the Great Lakes Region

Nearly 96,000 general dentists were employed in the U.S. as of May 2020 according to data published earlier this year by the U.S. Bureau of Labor Statistics (BLS).  Just over 13,000 general dentists were employed in the five-state Great Lakes region.  For general dentists, the region was among the better paying regions in the country.  The annual mean wage for general dentists in four of the five states in the region topped the national average.  One of those states was Michigan, which ranked among the ten best states in the nation for general dentist annual mean wages.  A closer review of May 2020 BLS data produced the following details about general dentist pay in the Great Lakes region:

General Dentist Pay in the Great Lakes Region

General Dentist Pay in the Great Lakes Region

State # Employed Annual Mean Wages Wage Rank*
IL 3,660 $198,480 17th
IN 2,110 $171,730 33rd
MI 2,540 $213,250 9th
OH 3,070 $196,920 18th
WI 1,650 $200,640 15th
U.S. 95,920 $180,830 -------

(*) annual mean wage ranking among the 50 states

Source: U.S. Bureau of Labor Statistics OES. Data extracted on May 12, 2021