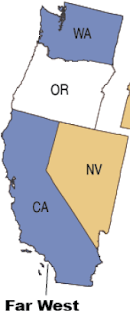
In 2019, more than 39,700 deaths in the U.S. were the result of firearm incidents. That put the 2019 firearms death rate (12.1 deaths per 100,000 population) almost 17.5% higher than where it was twenty years earlier (10.3 deaths per 100,000 population in 1999). While the national firearms death rate jumped between 1999 and 2019, in the six-state U.S. Far West region the firearms death rate went the opposite direction, dropping about 7% during the same period. That said, the region's overall favorable trend was heavily influenced by a nearly 18% drop in California's firearms death rate and similar improvement in Nevada. Other states in the region did not fare as well, with all recording materially higher firearms death rates in 2019 than twenty years earlier.. A further examination of data from the CDC's National Center for Health Statistics reveals the following about firearm deaths in the U.S. Far West region:
 |
| Firearms Deaths in the U.S. Far West |
| State/Deaths | 1999 | 2009 | 2019 |
| AK | 88 | 104 | 179 |
| CA | 3,054 | 3,094 | 2,945 |
| HI | 42 | 47 | 62 |
| NV | 375 | 406 | 490 |
| OR | 389 | 417 | 566 |
| WA | 585 | 623 | 842 |
| Region | 4,533 | 4,691 | 5,084 |
| U.S. | 28,874 | 31,347 | 39,707 |
| State/Death Rate* | 1999 | 2009 | 2019 |
| AK | 14.1 | 14.9 | 24.5 |
| CA | 9.1 | 8.4 | 7.5 |
| HI | 3.5 | 3.5 | 4.4 |
| NV | 19.4 | 15.1 | 15.9 |
| OR | 11.5 | 10.9 | 13.4 |
| WA | 10.0 | 9.3 | 11.1 |
| Region | 9.7 | 9.0 | 9.0 |
| U.S. | 10.3 | 10.2 | 12.1 |
(*) number of firearm-caused deaths per 100,000 population
Source: CDC Wonder. Centers for Disease Control and Prevention, National Center for Health Statistics. Underlying Cause of Death 1999-2019 on CDC WONDER Online Database, released in 2020. Data are from the Multiple Cause of Death Files, 1999-2019, as compiled from data provided by the 57 vital statistics jurisdictions through the Vital Statistics Cooperative Program. Accessed on June 2, 2021
No comments:
Post a Comment
Let us know what you think about today's commentary!