Sunday, April 30, 2023

The Great Plains' Primary Care Shortage

When residents of a geographic area, facility, or population group have poor access to basic medical care because too few primary care physicians are serving the area relative to its population size, the setting can be designated a primary care HPSA (health professional shortage area) by the Health Resources and Services Administration (HRSA).  As of December 31, 2022, the HRSA reported that more than 98.5 million Americans lived in designated primary care HPSAs.  The seven-state Great Plains region had 6.1 million residents who lived in a primary care shortage area as of 12/31/22.  This number represented about 6.2% of the U.S. population that was living in primary care shortage areas at that time.  The HRSA estimates that to eliminate the shortage Great Plains region HPSAs would need 1,221 additional primary care physicians.  As such, the region accounted for about 7.2% of the national deficit of primary care physicians.  A closer review of 12/31/22 HRSA data reveals the following state-level details about the Great Plains' primary care shortage:

The Great Plains' Primary Care Shortage

The Great Plains' Primary Care Shortage

State (1) HPSAs (2) Population (3) Shortage
IA 175 850,095 156
KS 190 823,846 133
MN 219 1,524,235 212
MO 363 2,294,436 600
NE 93 75,705 15
ND 93 229,048 49
SD 104 309,479 56
Region 1,237 6,106,844 1,221
U.S. 8,294 98,537,257 17,065
% of U.S. 14.9% 6.2% 7.2%

(1) Designated Geographic, Population Group, and Facility HPSAs with a primary care shortage
(2) Population of designated HPSAs
(3) Primary Care practitioners needed to remove HPSA Designation

Source:  Designated HPSA Quarterly Summary, 12/31/22 (HRSA)

Saturday, April 29, 2023

Male Heart Disease Death Rates in the U.S. by Region

Of the nearly 697,000 heart disease deaths in the United States in 2020, 382,776 were men.  At 235.9 deaths per 100,000 population, the heart disease death rate for males in the U.S. in 2020 was about 25.5% higher than the female rate and  11.5% greater than the overall national heart disease death rate.  At the regional level, the male heart disease death rate was lowest in the five-state Rocky Mountain region and the highest in the five-state Great Lakes region.  A deeper dive into data from the National Center for Health Statistics details the following about male heart disease rates in the U.S. by region (follow the "region" links below for male heart disease death rate information at the state level within each region):

Male Heart Disease Death Rates in the U.S. by Region

Region Deaths Population Death Rate*
Far West 54,932 28,192,091 194.8
Great Lakes 61,269 23,061,455 265.7
Great Plains 24,559 10,673,839 230.1
Mid-East 61,361 23,747,834 258.4
New England 15,387 7,242,931 212.4
Rocky Mountain 10,593 6,320,743 167.6
Southeast 109,168 41,736,692 261.6
Southwest 45,507 21,280,617 213.8
U.S. Male Only 382,776 162,256,202 235.9
U.S. Female Only 314,186 167,227,921 187.9
U.S. Total 696,962 329,484,123 211.5

(*) number of heart disease deaths per 100,000 population

Report Period: 2020

Source: CDC Wonder. Centers for Disease Control and Prevention, National Center for Health Statistics. Underlying Cause of Death 1999-2020 on CDC WONDER Online Database, released in 2021. Data are from the Multiple Cause of Death Files, 1999-2020, as compiled from data provided by the 57 vital statistics jurisdictions through the Vital Statistics Cooperative Program. Accessed on April 22, 2023

20 Best Metropolitan Markets for Dental Assistant Pay

As examined in Dental Assistant Pay in the Top 20 Metropolitan Markets, the biggest metro areas are the major U.S. centers for dental assistant employment. That fact notwithstanding, a closer look into U.S. Bureau of Labor Statistics (BLS) data reveals that smaller metro areas are where dental assistants frequently find better pay, sometimes much better.  Indeed, a review of BLS data from May 2022 shows us that just four of the top 20 U.S. metro areas were among the 20 best metropolitan markets for dental assistant pay:

20 Best Metropolitan Markets for Dental Assistant Pay

Metropolitan Area # Employed Annual Mean Wages
1 San Francisco-Oakland-Hayward (#) 5,550 $62,830
2 San Jose-Sunnyvale-Santa Clara, CA 3,700 $61,130
3 Minneapolis-St. Paul-Bloomington (#) 3,930 $61,020
4 Santa Rosa, CA 680 $56,750
5 Rochester, MN 350 $56,510
6 Mankato-North Mankato, MN 110 $55,470
7 Santa Maria-Santa Barbara, CA 530 $54,850
8 St. Cloud, MN 240 $54,710
9 Bismarck, ND 190 $54,170
10 Burlington-South Burlington, VT 250 $54,050
11 Portland-Vancouver-Hillsboro, OR-WA 3,270 $53,350
12 Seattle-Tacoma-Bellevue, WA (#) 6,050 $53,330
13 Napa, CA 230 $53,280
14 Boston-Cambridge-Nashua, MA-NH (#) 7,330 $53,060
15 Vallejo-Fairfield, CA 540 $52,560
16 Salem, OR 550 $52,550
17 Fairbanks, AK 140 $52,500
18 Duluth, MN-WI 250 $52,360
19 Durham-Chapel Hill, NC 730 $52,160
20 El Centro, CA 120 $51,880
National 363,880 $44,710

(#) a top 20 U.S metro population area

Source: U.S. Bureau of Labor Statistics OES. Data extracted on April 26, 2023

Friday, April 28, 2023

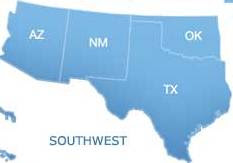
The Southwest's Dental Care Shortage

According to data from the Health Resources and Services Administration (HRSA), as of December 31, 2022, almost 69.8 million Americans lived in a dental health professional shortage area (HPSA).  A dental health HPSA is a geographic area, population group, or facility where access to dental care is impaired because too few dentists work in the area relative to the size of the population.  In the four-state Southwest, as of December 31, 2022, over 8.4 million residents lived in dental care shortage areas, representing about 12% of all Americans who lived in a dental health HPSA.  The HRSA estimates that HPSAs in the Southwest would need 1,363 more dentists to eliminate the dental care shortage in the region.  This deficit represented about 11.4% of the national shortage of dentists.  Here is a summary look at the Southwest's dental care shortage:

The Southwest's Dental Care Shortage

The Southwest's Dental Care Shortage


State (1) HPSAs (2) Population (3) Shortage
AZ 249 2,984,483 485
NM 112 1,187,842 223
OK 176 1,073,200 180
TX 320 3,157,537 475
Region 857 8,403,062 1,363
U.S. 7,313 69,766,605 11,909
% of U.S. 11.7% 12.0% 11.4%

(1) Designated Geographic, Population Group, and Facility HPSAs with a dental care shortage
(2) Population of designated HPSAs
(3) Dental Care practitioners needed to remove HPSA Designation

Source:  Designated HPSA Quarterly Summary, 12/31/22 (HRSA)

Dental Assistant Pay in the Top 20 Metropolitan Markets

According to data released recently by the U.S. Bureau of Labor Statistics (BLS), there were just under 363,900 dental assistants employed in the U.S. as of May 2022. The overwhelming majority of dental assistants work in dental offices, with small numbers found employed by employment agencies, physician offices, and outpatient care centers. While dental assistants must possess some technical understanding, many of their duties can be administrative in nature and don't require the kind of advanced skills or training required by many other healthcare occupations. Dental assistants, on average, earn lower salaries than workers in most other occupations. As of May 2022, the BLS estimated that the national mean salary for dental assistants was $44,710 per year. Pay for the profession varies considerably depending upon the region in which a practitioner works, with dental assistants in some regions making materially more than what their professional peers made elsewhere. As of May 2022, BLS data reveals the following about dental assistant pay in the top 20 metropolitan markets in the United States:

Dental Assistant Pay in the Top 20 Metropolitan Markets

Metropolitan Area # Employed Mean Annual Wage
1 New York-Newark-Jersey City 20,750 $48,570
2 Los Angeles-Long Beach-Anaheim 20,160 $44,020
3 Chicago-Naperville-Elgin 10,220 $42,320
4 Dallas-Fort Worth-Arlington 10,550 $41,270
5 Houston-The Woodlands-Sugar Land 7,720 $39,080
6 Washington-Arlington-Alexandria 6,520 $48,430
7 Philadelphia-Camden-Wilmington 5,830 $48,040
8 Miami-Fort Lauderdale-Pompano Beach 8,080 $41,020
9 Atlanta-Sandy Springs-Alpharetta 6,760 $42,630
10 Boston-Cambridge-Newton 7,330 $53,060
11 Phoenix-Mesa-Chandler 6,610 $45,620
12 San Francisco-Oakland-Berkeley 5,550 $62,830
13 Riverside-San Bernardino-Ontario 5,120 $45,440
14 Detroit-Warren-Dearborn 5,540 $41,580
15 Seattle-Tacoma-Bellevue 6,050 $53,330
16 Minneapolis-St. Paul-Bloomington 3,930 $61,020
17 San Diego-Chula Vista-Carlsbad 5,050 $48,110
18 Tampa-St. Petersburg-Clearwater 3,010 $45,950
19 Denver-Aurora-Lakewood 3,420 $48,470
20 Baltimore-Columbia-Towson 1,860 $45,430
National 363,880 $44,710

Report Period:  May 2022
Top 20 U.S. Metro Areas from the 2020 Census
Source: U.S. Bureau of Labor Occupational Statistics
Data extracted on April 26, 2023

Thursday, April 27, 2023

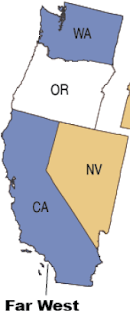
The Far West's Mental Health Care Shortage

The Health Resources and Services Administration (HRSA) designates a geographic area, population group, or facility where access to mental health care is substandard as a mental health HPSA (health professional shortage area). This designation can be based on the size of the HPSA's population relative to either (a) the number of psychiatrists that service the area, or (b) the combined number of psychiatrists and certain other types of mental health care providers that serve the community. Currently, most mental health HPSA designations are based on population size relative to the number of psychiatrists serving the community.

As of December 31, 2022, mental health care HPSAs in the six-state Far West region had 23.6 million residents, accounting for about 14.9% of the U.S. population who lived in mental health care shortage areas.  To eliminate the shortage, the HRSA estimates that Far West HPSAs would need 1,225 additional mental health care providers.  Further examination of HRSA data reveals the following state-level details about the Far West's mental health care shortage:

The Far West's Mental Health Care Shortage

The Far West's Mental Health Care Shortage

State (1) HPSAs (2) Population (3) Shortage
AK 322 419,792 21
CA 608 13,121,872 673
HI 32 496,429 28
NV 62 4,012,818 235
OR 141 2,392,363 114
WA 187 3,206,169 154
Region 1,352 23,649,443 1,225
U.S. 6,599 158,413,168 7,957
% of U.S. 20.5% 14.9% 15.4%

(1) Designated Geographic, Population Group, and Facility HPSAs with a mental health care shortage
(2) Population of designated HPSAs
(3) Mental Health Care practitioners needed to remove HPSA Designation

Source:  Designated HPSA Quarterly Summary, 12/31/22 (HRSA)

Wednesday, April 26, 2023

The Southeast's Primary Care Shortage

As designated by the Health Resources and Services Administration (HRSA), a primary care health professional shortage area (HPSA) is a geographic area, population group, or facility where residents have inadequate access to basic medical care because too few primary care physicians service that population.  As of December 31, 2022, more than 98.5 million Americans lived in HRSA-designated primary care HPSAs.  With over 32.8 million residents living in primary care shortage areas, the twelve-state Southeast accounted for one-third of the U.S. population who lived in primary care HPSAs as of 12/31/22.  The HRSA estimates that to eliminate this shortage, Southeast region HPSAs would need nearly 5,300 additional primary care physicians.  A deeper examination of 12/31/22 HRSA data reveals the following state-level view of the Southeast's primary care shortage:

The Southeast's Primary Care Shortage

The Southeast's Primary Care Shortage

State (1) HPSAs (2) Population (3) Shortage
AL 129 2,863,772 354
AR 127 1,105,866 144
FL 306 7,688,768 1,745
GA 247 3,369,911 683
KY 253 2,043,331 319
LA 183 2,590,723 298
MS 181 2,035,170 330
NC 222 3,216,821 498
SC 106 1,989,936 209
TN 148 2,582,889 304
VA 149 2,536,647 261
WV 120 787,032 138
Region 2,171 32,810,866 5,283
U.S. 8,294 98,537,257 17,065
% of U.S. 26.2% 33.3% 31.0%

(1) Designated Geographic, Population Group, and Facility HPSAs with a primary care shortage
(2) Population of designated HPSAs
(3) Primary Care practitioners needed to remove HPSA Designation

Source:  Designated HPSA Quarterly Summary, 12/31/22 (HRSA)

Tuesday, April 25, 2023

Female Heart Disease Death Rates in the U.S. by Region

Women accounted for 314,186 of the nearly 697,000 heart disease deaths in the United States in 2020.  At 187.9 deaths per 100,000 population, the heart disease death rate for females in the U.S. in 2020 was about 20% lower than the male rate and  11.1% lower than the overall national heart disease death rate.  At the regional level, the female heart disease death rate was lowest in the five-state Rocky Mountain region and the highest in the Mid-Eastern U.S., a region that includes the District of Columbia and five states.  A closer examination of data from the CDC's National Center for Health Statistics provides the following details about female heart disease rates in the U.S. by region (follow the "region" links below for female heart disease death rate information at the state level within each region):

Female Heart Disease Death Rates in the U.S. by Region

Region Deaths Population Death Rate*
Far West 54,932 28,192,091 194.8
Great Lakes 51,675 23,773,455 217.4
Great Plains 20,501 10,807,995 189.7
Mid-East 56,010 25,009,994 224.0
New England 13,193 7,604,537 173.5
Rocky Mountain 8,470 6,226,673 136.0
Southeast 87,506 43,829,093 199.7
Southwest 34,947 21,588,645 161.9
U.S. Female Only 314,186 167,227,921 187.9
U.S. Male Only 382,776 162,256,202 235.9
U.S. Total 696,962 329,484,123 211.5

(*) number of heart disease deaths per 100,000 population

Report Period: 2020

Source: CDC Wonder. Centers for Disease Control and Prevention, National Center for Health Statistics. Underlying Cause of Death 1999-2020 on CDC WONDER Online Database, released in 2021. Data are from the Multiple Cause of Death Files, 1999-2020, as compiled from data provided by the 57 vital statistics jurisdictions through the Vital Statistics Cooperative Program. Accessed on April 22, 2023

Monday, April 24, 2023

New England's Dental Care Shortage

December 31, 2022, data from the HRSA (Health Resources and Services Administration) indicated that nearly 69.8 million Americans lived in a dental health HPSA (health professional shortage area).  A dental health HPSA is a population group, geographic area, or facility where residents have substandard dental care access because too few dentists serve the area relative to the population living in the HPSA.  HPSAs in the six-state New England region of the country were home to almost 1.4 million residents, or about 2% of the U.S. population, who lived in dental care shortage areas.  The HRSA estimates that New England HPSAs would need 224 more dentists in order to eliminate the dental care shortage in the region.  This shortfall represented about 1.9% of the nation's dental care shortage.  Further examination of the HRSA's 12/31/22 data provides the following details about New England's dental care shortage:

New England's Dental Care Shortage

New England's Dental Care Shortage

State (1) HPSAs (2) Population (3) Shortage
CT 40 481,721 110
ME 96 380,414 59
MA 61 327,538 21
NH 23 35,002 9
RI 13 140,648 23
VT 15 29,428 2
Region 248 1,394,751 224
U.S. 7,313 69,766,605 11,909
% of U.S. 3.4% 2.0% 1.9%

(1) Designated Geographic, Population Group, and Facility HPSAs with a dental care shortage
(2) Population of designated HPSAs
(3) Dental Care practitioners needed to remove HPSA Designation

Source:  Designated HPSA Quarterly Summary, 12/31/22 (HRSA)

Sunday, April 23, 2023

The Rocky Mountain Region's Mental Health Care Shortage

A facility, geographic area, or population group where individuals have subpar access to mental health care services can be designated by the Health Resources and Services Administration (HRSA) as a health professional shortage area (HPSA).  A healthcare shortage designation from the HRSA is based on population size relative to the number of providers who service that population. In the case of mental health care, that designation can be based on either (a) the size of the HPSA population relative to the number of psychiatrists that serve the community or (b) the size of the HPSA population relative to the combined number of psychiatrists and certain other mental health practitioners (clinical social workers, clinical psychologists, etc.) who service the HPSA. According to the HRSA, most mental health care shortage designations are currently based on the number of psychiatrists that serve the HPSA setting or community.  As of December 31, 2022, the HRSA reports that more than 158.4 million Americans lived in mental health HPSAs.

As of December 31, 2022, the five-state Rocky Mountain region was home to more than 9.6 million residents who lived in mental health care shortage areas.  The HRSA estimates that Rocky Mountain region HPSAs would need 372 additional mental health care providers to eliminate the shortage in the region.  As such, HPSAs in the Rocky Mountain region accounted for about 6.1% of the U.S. population who lived in mental health care shortage areas and approximately 4.7% of the national deficit of mental health care providers.  A closer examination of HRSA data reveals the following state-level details about the Rocky Mountain region's mental health care shortage:

The Rocky Mountain Region's Mental Health Care Shortage

The Rocky Mountain Region's Mental Health Care Shortage

State (1) HPSAs (2) Population (3) Shortage
CO 73 2,831,663 114
ID 72 2,209,556 82
MT 122 986,301 70
UT 50 2,921,191 78
WY 26 699,712 28
Region 343 9,648,423 372
U.S. 6,599 158,413,168 7,957
% of U.S. 5.2% 6.1% 4.7%

(1) Designated Geographic, Population Group, and Facility HPSAs with a mental health care shortage
(2) Population of designated HPSAs
(3) Mental Health Care practitioners needed to remove HPSA Designation

Source:  Designated HPSA Quarterly Summary, 12/31/22 (HRSA)

Saturday, April 22, 2023

The MidEast Region's Primary Care Shortage

A geographic area, population group, or facility where residents have substandard access to basic medical care due to a lack of primary care physicians can be designated a primary care HPSA (health professional shortage area) by the Health Resources and Services Administration (HRSA).  As of December 31, 2022, more than 98.5 million Americans lived in primary care HPSAs as designated by the HRSA.  More than 9.6 million residents of the MidEast region of the U.S., which includes the District of Columbia and five states, lived in a primary care HPSA.  The MidEast region thus accounted for just about 9.7% of the U.S. population who lived in primary care shortage areas.  The HRSA estimates that to eliminate the region's primary care shortage, MidEast HPSAs would need more than 2,000 additional primary care physicians.  A closer examination of 12/31/22 HRSA data reveals the following about the MidEast region's primary care shortage:

The MidEast Region's Primary Care Shortage

The MidEast Region's Primary Care Shortage

State (1) HPSAs (2) Population (3) Shortage
DC 19 545,480 122
DE 11 253,696 75
MD 76 1,748,349 354
NJ 38 29,048 21
NY 194 6,449,663 1,348
PA 153 580,050 109
Region 491 9,606,286 2,029
U.S. 8,294 98,537,257 17,065
% of U.S. 5.9% 9.7% 11.9%

(1) Designated Geographic, Population Group, and Facility HPSAs with a primary care shortage
(2) Population of designated HPSAs
(3) Primary Care practitioners needed to remove HPSA Designation

Source:  Designated HPSA Quarterly Summary, 12/31/22 (HRSA)
Friday, April 21, 2023

Male vs. Female Heart Disease Death Rates in the Great Plains Region

The U.S. recorded over 696,900 deaths in 2020 that were attributable to heart disease.  The seven-state Great Plains region accounted for 45,060 of those heart disease deaths in 2020.   At  209.8 heart disease deaths per 100,000 population, the region had the fourth-highest regional heart disease death rate in 2020.  As seen throughout the U.S., the heart disease death rate for women in the Great Plains region was notably lower than the male rate.  The heart disease death rate for men in the region was slightly better than it was for males nationally, whereas the death rate for women in the region was slightly worse than for females nationally. Further examination of data from the National Center for Health Statistics yields the following details about male vs. female heart disease death rates in the Great Plains region:

Male vs. Female Heart Disease Death Rates in the Great Plains Region

Male vs. Female Heart Disease Death Rates in the Great Plains Region

Deaths Population Death Rate*
Regionwide 45,060 21,481,834 209.8
     Male 24,559 10,673,839 230.1
     Female 20,501 10,807,995 189.7
Nationwide     696,962 329,484,123 211.5
     Male 382,776 162,256,202 235.9
     Female 314,186 167,227,921 187.9

(*) number of heart disease deaths per 100,000 population

Report Period: 2020

States in Region:  Iowa, Kansas, Minnesota, Missouri, Nebraska, North Dakota, and South Dakota

Source: CDC Wonder. Centers for Disease Control and Prevention, National Center for Health Statistics. Underlying Cause of Death 1999-2020 on CDC WONDER Online Database, released in 2021. Data are from the Multiple Cause of Death Files, 1999-2020, as compiled from data provided by the 57 vital statistics jurisdictions through the Vital Statistics Cooperative Program. Accessed on April 15, 2023