Monday, October 31, 2022

20 Best Metropolitan Areas for Chiropractor Pay

In an earlier commentary, we examined Chiropractor Pay in the Top 20 Metropolitan Areas.  While the largest U.S. metropolitan areas usually have more job openings for chiropractors, many smaller metro areas, and even some non-metro areas, are where practitioners enjoy better average compensation. In fact, May 2021 data from the U.S. Bureau of Labor Statistics (BLS) shows that only three of the largest metro areas in the nation were among the 20 best metropolitan areas for chiropractor pay:

20 Best Metropolitan Areas for Chiropractor Pay

Metropolitan Area # Employed Annual Mean Wages
1 Hartford - West & East Hartford, CT 80 $140,450
2 Eastern Wyoming non-metro 30 $116,580
3 Reno, NV 90 $114,560
4 New York/Newark/Jersey City (#) 1,210 $113,420
5 Las Vegas-Henderson-Paradise, NV 250 $111,330
6 Spokane-Spokane Valley, WA 50 $111,090
7 St. Louis, MO-IL 340 $110,630
8 Syracuse, NY 40 $110,050
9 Eastern Ohio non-metro 40 $108,010
10 Green Bay, WI 90 $107,570
11 Salem, OR 60 $107,300
12 Bridgeport-Stamford-Norwalk, CT 50 $105,400
13 Eugene, OR 40 $104,980
14 Washington-Arlington-Alexandria (#) 520 $103,820
15 Western North Dakota non-metro 60 $103,530
16 Sheboygan, WI 30 $103,320
17 Baton Rouge, LA 50 $102,750
18 New Bedford, MA 30 $102,390
19 Boston-Cambridge-Newton (#) 550 $102,340
20 New Orleans-Metairie, LA 130 $101,910
National 35,810 $81,240

Source: U.S. Bureau of Labor Statistics OES. Data extracted on October 26, 2022
Sunday, October 30, 2022

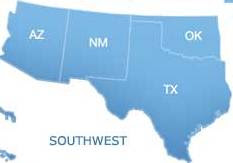
Top Ranked Pediatric Heart Hospitals in the Southwestern U.S.

In the newest (2022-23) survey of American hospitals released by U.S. News & World Report (USNWR), among the 50 hospitals recognized as the best in the U.S. for pediatric heart care, six were based in the four-state Southwestern region of the country.  Among that group was Texas Children's Hospital in Houston, which was rated as the nation's best children's hospital for pediatric heart care.  While other children's hospitals in the region may provide cardiology and heart surgery services, the six hospitals that earned a spot in the USNWR national survey stand out as the top-ranked pediatric heart hospitals in the Southwestern U.S.:


Top Ranked Pediatric Heart Hospitals in the Southwestern U.S.


Top Ranked Pediatric Heart Hospitals in the Southwestern U.S.


Texas Children's Hospital
Location:  Houston
National Pediatric Cardiology & Heart Surgery Ranking:  #1
See ranking details

Children's Medical Center Dallas
Location:  Dallas
National Pediatric Cardiology & Heart Surgery Ranking:  #28
See ranking details

Children's Memorial Hermann Hospital
Location:  Houston
National Pediatric Cardiology & Heart Surgery Ranking:  #35
See ranking details

Phoenix Children's Hospital
Location:  Phoenix
National Pediatric Cardiology & Heart Surgery Ranking:  #37
See ranking details

Oklahoma Children's Hospital OU Health
Location:  Oklahoma City
National Pediatric Cardiology & Heart Surgery Ranking:  #43
See ranking details

Cook Children's Medical Center
Location:  Fort Worth
National Pediatric Cardiology & Heart Surgery Ranking:  #48
See ranking details

For a closer look into the metrics used to rate pediatric heart hospitals in the 22-23 USNWR survey, or to find the pediatric heart care rating of other Southwestern region hospitals, visit Best Hospitals for Pediatric Cardiology and Heart Surgery.

Saturday, October 29, 2022

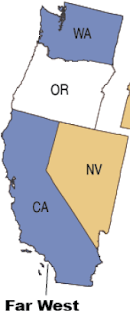
Drug-Induced Death Rates in the Far Western U.S.

In 2020 more than 96,000 drug-induced deaths were recorded in the U.S., about 29.2 such deaths per 100,000 population.  In contrast, a year earlier the U.S. recorded about 74,500 drug-related deaths or about 22.7 such deaths per 100,000 population.  The year-over-year increase in the number of U.S. drug-induced deaths was consistent with an ongoing negative trend, fueled by more frequent overdose deaths, that goes back at least two decades. Since 1999, the drug-induced death rate per 100,000 population in the U.S. has increased by more than 400%.  In 2020 the six-state Far Western region of the U.S. recorded nearly 13,700 drug-induced deaths, giving the region an overall drug-induced death rate of 24.2 such deaths per 100,000 population.  Collectively, the region's 2020 drug-induced death rate was about 17% below the national average, with every state in the region recording a death rate that was lower than the national average.  Further examination of data from the National Center for Health Statistics provides the following details about drug-induced death rates in the Far Western U.S.:

Drug-Induced Death Rates in the Far Western U.S.

Drug-Induced Death Rates in the Far Western U.S.

State Deaths Population Death Rate*
Alaska 179 731,158 24.5
California 9,452 39,368,078 24.0
Hawaii 307 1,407,006 21.8
Nevada 866 3,138,259 27.6
Oregon 997 4,241,507 23.5
Washington 1,896 7,693,612 24.6
     Region 13,697 56,579,620 24.2
U.S. Totals 96,096 329,484,123 29.2

(*) number of drug-induced deaths (intentional and unintentional) per 100,000 population

Report Period: 2020

Source: CDC Wonder. Centers for Disease Control and Prevention, National Center for Health Statistics. Underlying Cause of Death 1999-2020 on CDC WONDER Online Database, released in 2021. Data are from the Multiple Cause of Death Files, 1999-2020, as compiled from data provided by the 57 vital statistics jurisdictions through the Vital Statistics Cooperative Program. Accessed on October 24, 2022

Friday, October 28, 2022

20 Best Metro Areas for Health Services Management Pay

In a prior commentary, we examined Health Services Management Pay in the Top 20 Metro Areas.  While the biggest U.S. metropolitan areas are usually the home to the largest number of health services managerial jobs, it is often the smaller metro areas where better average compensation awaits.  Secondary and tertiary labor markets offer fewer employment opportunities, but the qualified labor pool is smaller too.  Consequently, employers in smaller metro markets sometimes pay more to attract and retain talent than do their big metro area counterparts.  May 2021 data from the U.S. Bureau of Labor Statistics (BLS) reveals that only five of the largest metro areas in the country were among the 20 best metro areas for health services management pay:

20 Best Metro Areas for Health Services Management Pay

Metropolitan Area # Employed Annual Mean Wages
1 San Jose-Sunnyvale-Santa Clara, CA 2,990 $162,110
2 Vallejo-Fairfield, CA 610 $157,340
3 New York-Newark-Jersey City (#) 28,240 $156,370
4 California-Lexington Park, MD 90 $150,900
5 San Francisco-Oakland-Hayward (#) 7,970 $150,250
6 Seattle-Tacoma-Bellevue, WA (#) 3,250 $147,610
7 Boston-Cambridge-Nashua (#) 13,570 $146,490
8 Bloomsburg-Berwick, PA 240 $146,360
9 Santa Rosa, CA 640 $144,560
10 Sacramento/Roseville/Arden-Arcade, CA 3,270 $141,090
11 Washington-Arlington-Alexandria (#) 9,410 $140,860
12 Ithaca, NY 60 $139,030
13 Hilton Head Island-Bluffton-Beaufort, SC 300 $137,710
14 Portland-Vancouver-Hillsboro, OR-WA 2,600 $137,410
15 Rochester, NY 1,050 $137,130
16 E. Sierra-Mother Lode CA non-metro 180 $136,390
17 Fargo, ND-MN 220 $136,040
18 Modesto, CA --- $135,980
19 Danbury, CT 340 $135,910
20 Salinas, CA 370 $135,820
National 436,770 $119,840

(#) a top 20 U.S metro population area

Source: U.S. Bureau of Labor Statistics OES. Data extracted on October 22, 2022

Surgical Technologist Pay in the Top 20 Metropolitan Areas

As of May 2021, according to the U.S. Bureau of Labor Statistics (BLS), there were about 109,000 surgical technologists employed in the United States. Surgical technologists are employed primarily in hospital settings, but smaller numbers can be found employed in outpatient care centers, physician offices, and dentist offices. While most surgical technologist jobs require post-secondary education and certain technical skills, the wage scale for surgical technologists is marginally lower than it is for workers in most occupations. In fact, according to BLS estimates, as of May 2021, the national mean wage for surgical technologists was $53,590 per annum. Surgical technologist pay varies considerably from region to region. May 2021 data from the BLS tells us the following about surgical technologist pay in the top 20 metropolitan areas in the United States:

Surgical Technologist Pay in the Top 20 Metropolitan Areas

Metropolitan Area # Employed Mean Annual Wage
1 New York-Newark-Jersey City 5,830 $62,540
2 Los Angeles-Long Beach-Anaheim 4,510 $67,020
3 Chicago-Naperville-Elgin 2,650 $53,490
4 Dallas-Fort Worth-Arlington 3,190 $54,760
5 Houston-The Woodlands-Sugar Land 2,920 $57,340
6 Washington-Arlington-Alexandria 1,150 $63,270
7 Philadelphia-Camden-Wilmington 1,850 $53,990
8 Miami-Fort Lauderdale-Pompano Beach 1,860 $49,600
9 Atlanta-Sandy Springs-Alpharetta 1,530 $55,380
10 Boston-Cambridge-Newton 1,460 $62,560
11 Phoenix-Mesa-Chandler 1,930 $56,950
12 San Francisco-Oakland-Berkeley 1,460 $80,170
13 Riverside-San Bernardino-Ontario 880 $58,240
14 Detroit-Warren-Dearborn 1,810 $48,920
15 Seattle-Tacoma-Bellevue 1,160 $65,040
16 Minneapolis-St. Paul-Bloomington 1,270 $64,540
17 San Diego-Chula Vista-Carlsbad 670 $68,010
18 Tampa-St. Petersburg-Clearwater 1,110 $49,010
19 Denver-Aurora-Lakewood 830 $61,660
20 Baltimore-Columbia-Towson 1,310 $52,990
National 109,060 $53,590

Report Period:  May 2021
Top 20 U.S. Metro areas from the 2020 Census
Source: U.S. Bureau of Labor Occupational Statistics
Data extracted on October 22, 2022

Wednesday, October 26, 2022

Top Ranked Pediatric Cancer Hospitals in the Rocky Mountain Region

Two hospitals in the five-state Rocky Mountain region were ranked among the 50 best hospitals in the nation for pediatric cancer care in the most recent (2022-23) survey of American hospitals conducted by U.S. News & World Report (USNWR).  This included Children's Hospital Colorado, which ranked among the top 10 pediatric cancer hospitals in the country.  While various hospitals in the region offer pediatric cancer care, the two hospitals that earned distinction in the USNWR national survey stand apart as the top ranked pediatric cancer hospitals in the Rocky Mountain region.

Top Ranked Pediatric Cancer Hospitals in the Rocky Mountain Region

Top Ranked Pediatric Cancer Hospitals in the Rocky Mountain Region


Children's Hospital Colorado
Location:  Aurora, CO
National Pediatric Cancer Care Ranking:  #8
see ranking details

Intermountain Primary Children's Hospital
Location:  Salt Lake City, UT
National Pediatric Cancer Care Ranking:  #39
see ranking details

For more insight into the metrics used to rate pediatric cancer care hospitals in the 22-23 USNWR survey, or to find the pediatric cancer care rating of other hospitals in the Rocky Mountain region, visit Best Hospitals for Pediatric Cancer Care

Tuesday, October 25, 2022

Drug-Induced Death Rates in the Mid-Eastern U.S.

Over 96,000 drug-induced deaths were recorded in the United States in 2020.  More than 95% of those fatalities stemmed from drug overdoses. Nationally, in 2020 there were approximately 29.2 drug-induced deaths per 100,000 population.  By comparison, in 2019 the U.S. recorded about 74,500 drug-related deaths and had a drug-induced death rate of 22.7 per 100,000 population.  The year-to-year deterioration in U.S. drug-induced death statistics was a continuation of a negative trend that goes back at least twenty years.  In 2020 the Mid-Eastern U.S., a region that includes five states and the District of Columbia, recorded nearly 17,100 drug-induced deaths, giving the region a collective drug-induced death rate of 35.0 such deaths per 100,000 population.  The region's collective drug-induced death rate was about 19.9% above the national average in 2020 as the District of Columbia and four states in the region recorded drug-induced death rates that were higher than the national average.  New York was the only state in the region with a drug-induced death rate lower than the national average in 2020.  Further examination of data from the CDC's National Center for Health Statistics reveals the following details about drug-induced death rates in the Mid-Eastern U.S.:

Drug-Induced Death Rates in the Mid-Eastern U.S

Drug-Induced Death Rates in the Mid-Eastern U.S

State Deaths Population Death Rate*
Delaware 448 986,809 45.4
District of Columbia 432 712,816 60.6
Maryland 2,814 6,055,802 46.5
New Jersey 2,921 8,882,371 32.9
New York 5,165 19,336,776 26.7
Pennsylvania 5,284 12,783,254 41.3
     Region 17,064 48,757,828 35.0
U.S. Totals 96,096 329,484,123 29.2

(*) number of drug-induced deaths (intentional and unintentional) per 100,000 population

Report Period: 2020

Source: CDC Wonder. Centers for Disease Control and Prevention, National Center for Health Statistics. Underlying Cause of Death 1999-2020 on CDC WONDER Online Database, released in 2021. Data are from the Multiple Cause of Death Files, 1999-2020, as compiled from data provided by the 57 vital statistics jurisdictions through the Vital Statistics Cooperative Program. Accessed on October 22, 2022

Monday, October 24, 2022

Speech-Language Pathologist Pay in the Top 20 Metro Areas

May 2021 data from the U.S. Bureau of Labor Statistics (BLS) indicates that there were about 147,500 speech-language pathologists (SLPs) employed in the United States. SLPs are employed in varied settings, including elementary and secondary schools, offices of non-physician health practitioners, hospitals, home health care agencies, and skilled nursing facilities. Most speech-language pathologist jobs require advanced training and skills, so like many other healthcare professions, the wage scale for SLPs is considerably higher than it is for workers in most occupations. As of May 2021, according to BLS estimates the national mean salary for speech-language pathologists was $85,820 annually. From region to region there is wide variation in SLP mean annual wages, with speech-language pathologists in some regions of the country earning 50% or more than their counterparts elsewhere. This variation is readily visible in BLS data from May 2021, which shows the following about speech-language pathologist pay in the top 20 metro areas in the U.S.:

Speech-Language Pathologist Pay in the Top 20 Metro Areas

Metropolitan Area # Employed Mean Annual Wage
1 New York-Newark-Jersey City 13,140 $106,030
2 Los Angeles-Long Beach-Anaheim 5,140 $100,530
3 Chicago-Naperville-Elgin 6,140 $85,570
4 Dallas-Fort Worth-Arlington 4,090 $82,840
5 Houston-The Woodlands-Sugar Land 2,580 $85,900
6 Washington-Arlington-Alexandria 2,350 $95,910
7 Philadelphia-Camden-Wilmington 2,980 $90,110
8 Miami-Fort Lauderdale-Pompano Beach 1,730 $90,620
9 Atlanta-Sandy Springs-Alpharetta 1,860 $79,050
10 Boston-Cambridge-Newton 3,160 $90,810
11 Phoenix-Mesa-Chandler 1,960 $86,010
12 San Francisco-Oakland-Berkeley 1,590 $118,260
13 Riverside-San Bernardino-Ontario 1,580 $97,680
14 Detroit-Warren-Dearborn 1,530 $80,370
15 Seattle-Tacoma-Bellevue 1,550 $93,260
16 Minneapolis-St. Paul-Bloomington 2,410 $80,070
17 San Diego-Chula Vista-Carlsbad 1,180 $101,150
18 Tampa-St. Petersburg-Clearwater 1,540 $83,840
19 Denver-Aurora-Lakewood 2,210 $93,990
20 Baltimore-Columbia-Towson 1,820 $85,990
National 147,470 $85,820

Report Period:  May 2021
Top 20 U.S. Metro areas from the 2020 Census
Source: U.S. Bureau of Labor Occupational Statistics
Data extracted on October 22, 2022

Sunday, October 23, 2022

Massage Therapist Pay in the Top 20 Metropolitan Markets

According to the U.S. Bureau of Labor Statistics (BLS), as of May 2021, there were about 81,000 massage therapists employed in the United States. Massage therapists are employed in a variety of settings, including spas, franchised clinics, physicians’ offices, hotels, and fitness centers. Most massage therapy jobs require postsecondary education and certain technical skills, but the massage therapist wage scale is considerably lower than it is for workers in most occupations. According to BLS estimates, as of May 2021, the national mean wage for massage therapists was $49,260 per year. The pay scale for the profession varies widely, with practitioners in some regions earning double what their peers make elsewhere.  This variation in pay is readily seen in May 2021 data from the BLS, which reveals the following about massage therapist pay in the top 20 metropolitan markets in the United States:

Massage Therapist Pay in the Top 20 Metropolitan Markets

Metropolitan Area # Employed Mean Annual Wage
1 New York-Newark-Jersey City 5,310 $49,930
2 Los Angeles-Long Beach-Anaheim 3,610 $52,810
3 Chicago-Naperville-Elgin 2,930 $56,880
4 Dallas-Fort Worth-Arlington 2,990 $45,430
5 Houston-The Woodlands-Sugar Land 2,220 $43,350
6 Washington-Arlington-Alexandria 1,240 $57,500
7 Philadelphia-Camden-Wilmington 1,260 $48,560
8 Miami-Fort Lauderdale-Pompano Beach 2,320 $45,470
9 Atlanta-Sandy Springs-Alpharetta 1,430 $39,830
10 Boston-Cambridge-Newton 1,570 $61,170
11 Phoenix-Mesa-Chandler 2,050 $46,390
12 San Francisco-Oakland-Berkeley 1,380 $64,030
13 Riverside-San Bernardino-Ontario 850 $51,950
14 Detroit-Warren-Dearborn 680 $59,420
15 Seattle-Tacoma-Bellevue 1,470 $67,950
16 Minneapolis-St. Paul-Bloomington 1,030 $49,630
17 San Diego-Chula Vista-Carlsbad 1,120 $49,940
18 Tampa-St. Petersburg-Clearwater 1,000 $43,720
19 Denver-Aurora-Lakewood 2,420 $48,770
20 Baltimore-Columbia-Towson 490 $56,160
National 81,030 $49,260

Report Period:  May 2021
Top 20 U.S. Metro areas from the 2020 Census
Source: U.S. Bureau of Labor Occupational Statistics
Data extracted on October 19, 2022

Friday, October 21, 2022

Drug-Induced Death Rates in the Southwestern U.S.

More than 96,000 drug-induced deaths, over 95% of which stemmed from overdoses, were recorded in the United States in 2020.  That is approximately 29.2 such deaths per 100,000 population.  These results were worse than in 2019 when the U.S. recorded just over 74,500 drug-related deaths and had a drug-induced death rate of 22.7 per 100,000 population.  The sharp year-to-year jump in U.S. drug-induced deaths was a continuation of an unfavorable trend that goes back at least two decades.  In 2020 the four-state Southwestern U.S. recorded nearly 8,700 drug-induced deaths, giving the region a collective drug-induced death rate of 20.3 such deaths per 100,000 population.  While the region's drug-induced death rate was 30% below the national average in 2020, these results were skewed by particularly low drug death rates in Texas, the largest populated state in the region.  Two states in the region, Arizona and New Mexico, recorded drug-induced death rates in 2020 that were well above the national average.  A closer examination of data from the National Center for Health Statistics reveals the following details about drug-induced death rates in the Southwestern U.S.:

Drug-Induced Death Rates in the Southwestern U.S.

Drug-Induced Death Rates in the Southwestern U.S.

State Deaths Population Death Rate*
Arizona 2,675 7,421,401 36.0
New Mexico 836 2,106,319 39.7
Oklahoma 801 3,980,783 20.1
Texas 4,384 29,360,759 14.9
     Region 8,696 42,869,262 20.3
U.S. Totals 96,096 329,484,123 29.2

(*) number of drug-induced deaths (intentional and unintentional) per 100,000 population

Report Period: 2020

Source: CDC Wonder. Centers for Disease Control and Prevention, National Center for Health Statistics. Underlying Cause of Death 1999-2020 on CDC WONDER Online Database, released in 2021. Data are from the Multiple Cause of Death Files, 1999-2020, as compiled from data provided by the 57 vital statistics jurisdictions through the Vital Statistics Cooperative Program. Accessed on October 19, 2022