Wednesday, May 7, 2025

Clinical Lab Tech Pay in the Far Western U.S.

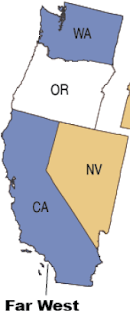
More than 337,000 clinical laboratory technicians and technologists were working in the United States as of May 2024 according to the most recent occupational employment data released by the U.S. Bureau of Labor Statistics (BLS).  Just under 44,500 of the nation's employed clinical lab techs were working in the six-state Far Western U.S. region.  For clinical lab techs, the Far West was one of the very best regions in the nation in terms of pay.  Nearly every state in the region had an average annual mean wage level for clinical lab techs that topped the national average. Moreover, three states in the region ranked in the top 10 nationally for clinical lab tech annual mean wages.  A closer examination of BLS data from May 2024 reveals the following details about clinical lab tech pay in the Far Western U.S.:

Clinical Lab Tech Pay in the Far Western U.S.

Clinical Lab Tech Pay in the Far Western U.S.

State # Employed Annual Mean Wages Wage Rank*
AK 700 $71,590 12th
CA 29,460 $76,690 6th
HI 1,260 $70,030 14th
NV 2,270 $63,600 24th
OR 3,020 $78,530 4th
WA 7,740 $73,280 10th
U.S. 337,740 $65,012 -------

(*) annual mean wage ranking among the 50 states and the District of Columbia

Source: U.S. Bureau of Labor Statistics OES. Data extracted on May 7, 2025

Monday, May 5, 2025

Dental Assistant Pay in the Great Plains Region

Data released recently from the U.S. Bureau of Labor Statistics (BLS) reported that, as of May 2024, more than 287,000 dental assistants were working in the United States.  About 24,000 dental assistants at work in May 2024 lived in the seven-state Great Plains region of the country.  BLS data reveals much disparity in the Great Plains region for dental assistant pay.  Dental assistants in Minnesota enjoy the highest average annual mean wage in the country, and North Dakota is another top 10 state for dental assistant annual mean wages.  However, about 53% of the region's dental assistants work in one of three states that rank 31st or worse for average annual mean wages for the profession.  A deeper dive into May 2024 BLS data details the following about dental assistant pay in the Great Plains region of the U.S.:

Dental Assistant Pay in the Great Plains Region

Dental Assistant Pay in the Great Plains Region

State # Employed Annual Mean Wages Wage Rank*
IA 3,540 $49,020 24th
KS 3,020 $42,490 42nd
MN 5,590 $63,680 1st
MO 7,380 $45,390 37th
NE 2,360 $46,300 31st
ND 920 $54,720 7th
SD 1,240 $49,080 23rd
U.S. 287,780 $48,225 -------

(*) annual mean wage ranking among the 50 states and the District of Columbia

Source: U.S. Bureau of Labor Statistics OES. Data extracted on May 5, 2025

The Ten Largest General Hospitals in Texas

According to certified bed count data in the Fourth Quarter 2024 Medicare Provider of Services file, the ten largest general hospitals in Texas were:


Saturday, May 3, 2025

The Primary Care Shortfall in the Rocky Mountain Region

The Health Resources and Services Administration (HRSA) designates as primary care health professional shortage areas (HPSA) those geographic units, population groups, or facilities where residents have substandard access to basic medical care. This designation indicates that there is a shortfall in the actual number of primary care physicians practicing in an area relative to the standard number normally needed to serve a population the size of the one found in the HPSA.  As of March 31, 2025, more than 77.2 million Americans lived in HRSA designated primary care shortage areas.  That figure included over 2.5 million residents of the five-state Rocky Mountain region.  The HRSA estimated that to eliminate the primary care shortfall in the region, Rocky Mountain area HPSAs would need 408 additional primary care physicians.  A more detailed breakdown of 3/31/25 HRSA data reveals the following about the primary care shortfall in the Rocky Mountain region:


The Primary Care Shortfall in the Rocky Mountain Region

The Primary Care Shortfall in the Rocky Mountain Region

State (1) HPSAs (2) Population (3) Shortfall
CO 120 836,096 159
ID 100 514,455 99
MT 134 315,114 54
UT 62 676,475 73
WY 41 182,633 23
Region 457 2,524,733 408
U.S. 7,749 77,253,848 13,364

(1) HRSA-designated Geographic Units, Population Groups, and Facilities with a primary care shortfall
(2) Population of designated HPSAs
(3) Primary Care practitioners needed to remove the HPSA Designation

Source:  Designated HPSA Quarterly Summary, 3/31/25 (HRSA)

Thursday, May 1, 2025

Nurse Practitioner Pay in the Great Lakes Region

The latest occupational employment data from the U.S. Bureau of Labor Statistics (BLS) put nurse practitioner (NP) employment in the U.S. at more than 303,000 as of May 2024.  With over 44,400 employed nurse practitioners, the five-state Great Lakes region accounted for 15% of all nurse practitioner jobs nationally in May 2024.  While one of the better regions in the U.S. for nurse practitioner employment, pay for NPs in the region was rather weak.  NP annual mean wages in all Great Lakes states, but one, were below the national average for the profession, with Ohio ranking among the bottom ten states nationally for nurse practitioner annual mean wages.  Further examination of May 2024 BLS data shows the following about nurse practitioner pay in the Great Lakes region:

Nurse Practitioner Pay in the Great Lakes Region

Nurse Practitioner Pay in the Great Lakes Region

State # Employed Annual Mean Wages Wage Rank*
IL 9,560 $128,880 23rd
IN 7,470 $126,520 33rd
MI 7,900 $127,200 29th
OH 14,550 $121,250 43rd
WI 4,950 $130,490 21st
U.S. 303,410 $130,077 -------

(*) annual mean wage ranking among the 50 states and the District of Columbia

Source: U.S. Bureau of Labor Statistics OES. Data extracted on May 1, 2025