Monday, December 30, 2024

Medical Assistant Pay in New England

The latest occupational employment data from the U.S. Bureau of Labor Statistics (BLS) put medical assistant (MA) employment at over 763,000 as of May 2023.  Nearly 37,000 of those medical assistant jobs were in the six-state New England region of the country.  BLS data indicates New England to be one of the strongest regions in the country for medical assistant pay.  MA annual mean wage levels in every New England state tops the national average, and two states in the region rank among the ten best nationally for medical assistant annual mean wages.  A closer look at May 2023 BLS data reveals the following about medical assistant pay in New England:

Medical Assistant Pay in New England

Medical Assistant Pay in New England

State # Employed Annual Mean Wages Wage Rank*
MA 16,260 $48,570 7th
CT 9,160 $46,630 10th
ME 3,960 $44,580 16th
NH 2,930 $45,490 12th
RI 3,080 $43,580 18th
VT 1,210 $44,710 15th
U.S. 763,020 $42,404 -------

(*) annual mean wage ranking among the 50 states and the District of Columbia

Source: U.S. Bureau of Labor Statistics OES. Data extracted on December 30, 2024
Thursday, December 26, 2024

Occupational Therapist Pay in the U.S. Southwest

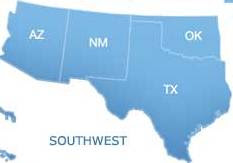
May 2023 employment data published earlier this year by the U.S. Bureau of Labor Statistics (BLS) reported that nearly 145,000 occupational therapists (OTs) were employed in the U.S.  About 15,000 of those OT jobs were in the four-state Southwestern region of the country.  BLS data revealed the Southwest region to be a relatively good one for OT pay with nearly 75% of the region's occupational therapists living in a state where the OT annual mean wage was above the national average.  This included Texas, which ranked among the ten best states in the U.S. for OT annual mean wage levels.  Drilling down into May 2023 BLS data revealed the following about occupational therapist pay in the U.S. Southwest:

Occupational Therapist Pay in the U.S. Southwest

Occupational Therapist Pay in the U.S. Southwest


State # Employed Annual Mean Wages Wage Rank*
AZ 2,620 $93,600 23nd
NM 910 $100,740 11th
OK 1110 $97,850 16th
TX 10,570 $101,610 9th
U.S. 144,850 $93,491 -------

(*) annual mean wage ranking among the 50 states and the District of Columbia

Source: U.S. Bureau of Labor Statistics OES. Data extracted on December 26, 2024

Tuesday, December 24, 2024

Dental Hygienist Pay in the Great Plains Region

Nearly 212,000 dental hygienists were working in the United States as of May 2023 according to the most current occupational data available from the U.S. Bureau of Labor Statistics (BLS).  At that time, more than 15,700 dental hygienists were working in the seven-state Great Plains region.  BLS data shows the region to be a modestly weak one for dental hygienist pay, as nearly every state in the region had an annual mean wage level for dental hygienists that fell below the national average. The region did not, however, have any states that ranked in the bottom third of states nationally for dental hygienist annual mean wages.  A closer examination of May 2023 BLS data reveals the following about dental hygienist pay in the Great Plains region:

Dental Hygienist Pay in the Great Plains Region

State # Employed Annual Mean Wages Wage Rank*
IA 2,260 $83,220 26th
KS 2,080 $79,160 40th
MN 4,990 $90,140 20th
MO 3,520 $79,740 38th
NE 1,570 $82,660 29th
ND 710 $80,130 36th
SD 610 $81,330 31st
U.S. 211,670 $87,035 -------

(*) annual mean wage ranking among the 50 states and the District of Columbia

Source: U.S. Bureau of Labor Statistics OES. Data extracted on December 24, 2024

Thursday, December 19, 2024

Surgical Technologist Pay in the U.S. Mid-East

May 2023 data released by the U.S. Bureau of Labor Statistics (BLS) earlier this years revealed that over 110,000 people were employed as surgical technologists in the United States. With over 15,000 surgical technologists employed, the U.S. Mid-East region, which encompasses five states and the District of Columbia, accounted for nearly 14% of U.S. surgical technologist employment. The region was a generally good one for surgical technologist pay, as four U.S. Mid-East states and the District of Columbia all had an annual mean wage level for surgical technologists that topped the national average.  However, more than a quarter of the surgical technologists in the region lived in Pennsylvania, where the annual mean wage level was 7% below the national average.  From May 2023 BLS data, here is a summary look at surgical technologist pay in the U.S. Mid-East:

Surgical Technologist Pay in the U.S. Mid-East

Surgical Technologist Pay in the U.S. Mid-East

State # Employed Annual Mean Wages Wage Rank*
DC 280 $69,230 11th
DE 370 $58,990 29th
MD 2,190 $63,050 19th
NJ 2,650 $70,240 10th
NY 5,190 $73,150 6th
PA 4,380 $58,900 30th
U.S. 110,320 $62,250 -------

(*) annual mean wage ranking among the 50 states and the District of Columbia

Source: U.S. Bureau of Labor Statistics OES. Data extracted on December 19, 2024

Wednesday, December 18, 2024

Pharmacy Technician Pay in the Southeast

May 2023 data published recently by the U.S. Bureau of Labor Statistics (BLS) reveals that more than 460,000 Americans were employed as pharmacy technicians. With over 136,000 pharmacy technicians employed, the twelve-state Southeast region accounted for about 30% of U.S. pharmacy technician employment. In general, the Southeast is the weakest region in the country for pharmacy technician pay as no state in the region features an annual mean wage for pharmacy technicians that exceeds the national average. Moreover, eight states in the Southeast rank in the bottom quintile nationally for pharmacy technician annual mean wages. From May 2023 BLS data, here is a summary look at pharmacy technician pay in the Southeast:

Pharmacy Technician Pay in the Southeast

State # Employed Annual Mean Wages Wage Rank*
AL 8,340 $37,030 51st
AR 4,550 $37,170 50th
FL 37,980 $41,620 28th
GA 14,740 $39,740 42nd
KY 10,160 $38,570 46th
LA 5,850 $39,540 43rd
MS 3,890 $38,260 47th
NC 15,440 $40,680 35th
SC 7,720 $40,100 39th
TN 12,350 $38,940 45th
VA 11,540 $41,650 27th
WV 3,530 $37,910 48th
U.S. 460,280 $43,330 -------

(*) annual mean wage ranking among the 50 states and the District of Columbia

Source: U.S. Bureau of Labor Statistics OES. Data extracted on December 18, 2024

Tuesday, December 17, 2024

Medical Transcriptionist Pay in the Rocky Mountain Region

The most recent occupational employment statistics available from the U.S. Bureau of Labor Statistics' (BLS) put medical transcriptionist employment at over 55,800 as of May 2021.  The five-state Rocky Mountain region accounted for an estimated 1,560 medical transcriptionist jobs at that time.  An examination of BLS data revealed the region to be generally moderate for medical transcriptionist pay. Although, Wyoming ranked the second highest in annual mean wage of any state nationwide.
However, the state also recorded the lowest level of employment. A deeper examination of BLS data from May 2021 reveals the following state-level details about medical transcriptionist pay in the Rocky Mountain region:


Although most of the region rated 

Medical Transcriptionist Pay in the Rocky Mountain Region

Medical Transcriptionist Pay in the Rocky Mountain Region


State # Employed Annual Mean Wages Wage Rank*
CO 1070 $40,590 21st
ID N/A $36,480 35th
MT 100 $42,490 16th
UT 340 $37,590 29th
WY 30 $49,260 2nd
U.S. 52,420 $39,090 -------

(*) annual mean wage ranking among the 50 states

Source: U.S. Bureau of Labor Statistics OES. Data accessed on December 17, 2024

Friday, December 13, 2024

Surgical Technologist Pay in the Far Western U.S.

Occupational employment data published most recently by the U.S. Bureau of Labor Statistics (BLS) revealed that over 110,000 surgical technologists were working in the United States as of May 2023. With just under 16,000 surgical technologists employed, the six-state Far Western U.S. accounted for about 14% of surgical technologist employment nationally. BLS data reveals the Far Western U.S. to be the premier region in the country for surgical technologist pay. Not only did all states in the region have a surgical technologist annual mean wage level that topped the national average, but five Far West states ranked among the ten best states in the nation for surgical technologist annual mean wages. From May 2023 BLS data, here is a state-level look at surgical technologist pay in the Far Western U.S.:

Surgical Technologist Pay in the Far Western U.S.

Surgical Technologist Pay in the Far Western U.S.

State # Employed Annual Mean Wages Wage Rank*
AK 290 $73,440 5th
CA 11,100 $76,170 2nd
HI 320 $67,650 12th
NV 970 $73,800 3rd
OR 1,120 $71,610 7th
WA 2,100 $73,580 4th
U.S. 110,320 $62,250 -------

(*) annual mean wage ranking among the 50 states and the District of Columbia

Source: U.S. Bureau of Labor Statistics OES. Data extracted on December 13, 2024

Wednesday, December 11, 2024

Pharmacy Technician Pay in the Great Plains Region

Data published recently by the U.S. Bureau of Labor Statistics (BLS) put pharmacy technician (PT) employment in the United States at more than 460,000 as of May 2023. Over 31,000 pharmacy technicians were employed in the seven-state Great Plains region. BLS data revealed the region to be a mixed one for pharmacy technician pay.  The positive was that the region was home to two states, Minnesota and North Dakota, that ranked among the ten best states in the nation for pharmacy technician annual mean wages. The negative was that over 70% of the region's employed PTs lived in a state where the annual mean wage for pharmacy technicians was below the national average. From May 2023 BLS data, here is a summary look at pharmacy technician pay in the Great Plains region:

Pharmacy Technician Pay in the Great Plains Region

State # Employed Annual Mean Wages Wage Rank*
IA 4,480 $41,080 33rd
KS 4,260 $39,820 41st
MN 8,050 $46,430 8th
MO 10,110 $39,960 40th
NE 2,560 $40,610 37th
ND 890 $45,870 9th
SD 1,140 $41,140 32nd
U.S. 460,280 $43,330 -------

(*) annual mean wage ranking among the 50 states and the District of Columbia

Source: U.S. Bureau of Labor Statistics OES. Data extracted on December 11, 2024

Tuesday, December 10, 2024

Medical Transcriptionist Pay in New England

The most current occupational employment data available from the U.S. Bureau of Labor Statistics' (BLS) put the number of working medical transcriptionists at more than 1,470 as of May 2023.  At that time, about 3% of all medical transcriptionist jobs were in the six-state New England region.  An examination of BLS data revealed New England to be one of the top paying regions in the nation for medical transcriptionists. Every New England state recorded a medical transcriptionist annual mean wage level that exceeded the national average for the profession, with Connecticut ranked as the 3rd highest state in the nation for medical transcriptionist annual mean wages.  A closer review of BLS data from May 2023 reveals the following about medical transcriptionist pay in New England:

Medical Transcriptionist Pay in New England

Medical Transcriptionist Pay in New England

State # Employed Annual Mean Wages Wage Rank*
CT 680 $47,480 3rd
MA 560 $44,400 8th
ME 80 $45,640 6th
NH 60 $38,120 27th
RI 90 $40,630 19th
VT N/A N/A N/A
U.S. 52,420 $39,090 -------

(*) annual mean wage ranking among the 50 states

Source: U.S. Bureau of Labor Statistics OES. Data accessed on December 10, 2024

Monday, December 9, 2024

Surgical Technologist Pay in the Great Lakes Region

The latest occupational employment data released by the U.S. Bureau of Labor Statistics (BLS) revealed that more than 110,000 people were employed as surgical technologists in the United States as of May 2023. With over 16,000 surgical technologists employed, the Great Lakes region accounted for 15% of U.S. surgical technologist employment. Per BLS data, the region was a modestly weak one for surgical technologist pay, as only one state, Wisconsin, had an annual mean wage level for surgical technologists that topped the national average.  Moreover, nearly 26% of the surgical technologists in the region lived in Ohio, where the annual mean wage level was nearly 9% below the national average.  From May 2023 BLS data, here is a summary look at surgical technologist pay in the Great Lakes region:

Surgical Technologist Pay in the Great Lakes Region

Surgical Technologist Pay in the Great Lakes Region

State # Employed Annual Mean Wages Wage Rank*
IL 3,290 $59,860 24th
IN 2,610 $58,760 31st
MI 3,790 $57,920 33rd
OH 4,320 $57,140 36th
WI 2,660 $65,620 15th
U.S. 110,320 $62,250 -------

(*) annual mean wage ranking among the 50 states and the District of Columbia

Source: U.S. Bureau of Labor Statistics OES. Data extracted on December 9, 2024

Thursday, December 5, 2024

Pharmacy Technician Pay in the Southwest

The latest occupational employment data released by the U.S. Bureau of Labor Statistics (BLS) shows more than 460,000 Americans being employed as pharmacy technicians as of May 2023. With 57,900 pharmacy technicians employed, the four-state Southwest region accounted for just under 13% of U.S. pharmacy technician employment. Although Oklahoma rated as one of the ten worst states in the nation for pharmacy technician annual mean wages, the region as a whole was a modestly decent one for pharmacy technician pay.  From May 2023 BLS data, here is a summary look at pharmacy technician pay in the Southwest:

Pharmacy Technician Pay in the Southwest

Pharmacy Technician Pay in the Southwest


State # Employed Annual Mean Wages Wage Rank*
AZ 11,030 $45,260 11th
NM 2,660 $42,900 20th
OK 5,250 $37,410 49th
TX 38,960 $42,990 19th
U.S. 460,280 $43,330 -------

(*) annual mean wage ranking among the 50 states and the District of Columbia

Source: U.S. Bureau of Labor Statistics OES. Data extracted on December 5, 2024

Wednesday, December 4, 2024

Medical Transcriptionist Pay in the Mid-Eastern U.S.

The most current occupational employment data available from the U.S. Bureau of Labor Statistics' (BLS) put the number of medical transcriptionists working in the U.S. at more than 52,000 as of May 2023.  BLS data revealed the Mid-Eastern U.S. region to be a modest region for medical transcriptionist pay, with all five Mid-Eastern states recording an annual mean wage level for medical transcriptionists that was above the national average for the profession.  This included New Jersey, which ranked among the top ten states in the nation for medical transcriptionist annual mean wages.  Additional examination of BLS data from May 2023 reveals the following details about medical transcriptionist pay in the Mid-Eastern U.S.:

Medical Transcriptionist Pay in the Mid-Eastern U.S.

Medical Transcriptionist Pay in the Mid-Eastern U.S.

State # Employed Annual Mean Wages Wage Rank*
DE 80 $43,350 13th
MD 400 $40,010 24th
NJ 1,100 $44,180 9th
NY 5,180 $40,610 20th
PA 1,990 $37,720 28th
U.S. 52,420 $39,090 -------

(*) annual mean wage ranking among the 50 states

Source: U.S. Bureau of Labor Statistics OES. Data accessed on December 4, 2024

Tuesday, December 3, 2024

Surgical Technologist Pay in the Southeast

May 2023 data recently released by the U.S. Bureau of Labor Statistics (BLS) reveals that more than 110,000 people were employed as surgical technologists in the United States. With over 31,700 surgical technologists employed, the twelve-state Southeast region accounted for nearly 29% of U.S. surgical technologist employment. The Southeast is the weakest region in the country for surgical technologist pay, with Virginia being the only state in the region with an annual mean wage for surgical technologists that exceeds the national average. Moreover, seven states in the Southeast ranked in the bottom ten nationally for surgical technologist annual mean wages. From May 2023 BLS data, here is a summary look at surgical technologist pay in the Southeast:

Surgical Technologist Pay in the Southeast

State # Employed Annual Mean Wages Wage Rank*
AL 2,330 $46,060 51st
AR 1,540 $50,080 48th
FL 8,430 $56,730 38th
GA 3,910 $59,620 25th
KY 2,110 $52,440 45th
LA 1,550 $51,830 46th
MS 1,080 $47,110 50th
NC 3,550 $54,660 40th
SC 2,420 $55,570 39th
TN 2,030 $57,130 37th
VA 2,220 $66,380 13th
WV 570 $48,720 49th
U.S. 110,320 $62,250 -------

(*) annual mean wage ranking among the 50 states and the District of Columbia

Source: U.S. Bureau of Labor Statistics OES. Data extracted on December 3, 2024

Monday, December 2, 2024

Pharmacy Technician Pay in New England

May 2023 data released earlier this year by the U.S. Bureau of Labor Statistics (BLS) revealed that over 460,000 Americans were working as pharmacy technicians. With over 21,000 pharmacy technicians employed, the six-state New England region accounted for about 5% of U.S. pharmacy technician employment. From May 2023 BLS data, here is a summary look at pharmacy technician pay in New England and the U.S. as a whole:

Pharmacy Technician Pay in New England

Pharmacy Technician Pay in New England

State # Employed Annual Mean Wages Wage Rank*
CT 4,930 $43,220 18th
MA 9,840 $46,450 7th
ME 2,220 $40,260 38th
NH 2,160 $42,540 22nd
RI 1,590 $42,360 23rd
VT 850 $41,360 30th
U.S. 460,280 $43,330 -------

(*) annual mean wage ranking among the 50 states and the District of Columbia

Source: U.S. Bureau of Labor Statistics OES. Data extracted on December 2, 2024