Saturday, June 7, 2025

The Mental Health Care Shortfall in the Mid-Eastern U.S.

A population group, facility, or geographic area where access to mental health care is poor due to an inadequate number of practitioners may be designated by the Health Resources and Services Administration (HRSA) as a mental health HPSA (health professional shortage area). As of March 31, 2025, more than 122.3 million Americans lived in a mental health care shortfall area according to HRSA data.  That figure included nearly 6.9 million residents living in the Mid-Eastern U.S., a region that encompasses five states and the District of Columbia.  The HRSA estimates that HPSAs in the Mid-Eastern U.S. would need 453 more mental health care practitioners to eliminate the shortfall in the region.  A closer examination of March 31, 2025, HRSA data reveals the following about the mental health care shortfall in the Mid-Eastern U.S.:

The Mental Health Care Shortfall in the Mid-Eastern U.S.

The Mental Health Care Shortfall in the Mid-Eastern U.S.

State (1) HPSAs (2) Population (3) Shortfall
DE 12 316,367 41
DC 11 126,214 8
MD 48 1,515,872 81
NJ 39 404,293 28
NY 197 3,662,589 230
PA 119 857,739 65
Region 426 6,883,274 453
U.S. 6,418 122,383,988 6,202

(1) HRSA-designated Geographic Units, Population Groups, and Facilities with a mental health care shortfall
(2) Population of designated HPSAs
(3) Mental Health Care practitioners needed to remove HPSA Designation

Source:  Designated HPSA Quarterly Summary, March 31, 2025 (HRSA)

Thursday, June 5, 2025

Family Medicine Physician Pay in New England

According to recently published data from the U.S. Bureau of Labor Statistics (BLS), as of May 2024, there were just over 104,000 family medicine physicians employed across the United States. Of these, 6,120 were practicing in the six-state New England region.

BLS data highlights a significant pay disparity among family medicine physicians in New England. Massachusetts stands out, accounting for more than half of the region’s family medicine employment and ranking in the top 10 nationally for annual mean wages. In contrast, the other five New England states report average salaries below the national average.

The May 2024 BLS data provides the following insights into family medicine physician compensation across New England:

Family Medicine Physician Pay in New England

Family Medicine Physician Pay in New England

State # Employed Annual Mean Wages Wage Rank*
CT 900 $213,400 45th
MA 3,550 $301,270 4th
ME 630 $221,190 42nd
NH 410 $248,550 28th
RI 280 $244,270 30th
VT 350 $238,710 32nd
U.S. 104,780 $253,047 -------

(*) annual mean wage ranking among the 50 states and the District of Columbia

Source: U.S. Bureau of Labor Statistics OES. Data extracted on June 5, 2025

Wednesday, June 4, 2025

The Primary Care Shortfall in the Great Plains Region

Whenever residents of geographic areas, facilities, or population groups have subpar access to basic medical care because too few primary care physicians serve the area relative to its population, the setting can be designated a primary care HPSA (health professional shortage area) by the Health Resources and Services Administration (HRSA).  As of March 31, 2025, the HRSA reported that more than 77.2 million Americans lived in primary care HPSAs.  That included just over 5.4 million residents of the seven-state Great Plains region.  This number represented almost 7% of the U.S. population that was living in a primary care shortfall area at that time.  The HRSA estimates that to eliminate the shortfall Great Plains region HPSAs would need 1,080 additional primary care physicians.  An examination of HRSA data details the following about the primary care shortfall in the Great Plains region:

The Primary Care Shortfall in the Great Plains Region

The Primary Care Shortfall in the Great Plains Region

State (1) HPSAs (2) Population (3) Shortfall
IA 161 745,778 162
KS 160 676,611 113
MN 212 1,415,841 201
MO 336 1,878,341 476
NE 131 235,596 33
ND 87 182,247 39
SD 99 267,936 56
Region 1,186 5,402,350 1,080
U.S. 7,749 77,253,848 13,364

(1) HRSA-designated Geographic Units, Population Groups, and Facilities with a primary care shortfall
(2) Population of designated HPSAs
(3) Primary Care practitioners needed to remove the HPSA Designation

Source:  Designated HPSA Quarterly Summary, 3/31/25 (HRSA)

Tuesday, June 3, 2025

Speech Language Pathologist Pay in the Great Plains Region

The U.S. Bureau of Labor Statistics' (BLS) most current occupational employment data indicated that nearly 174,000 speech language pathologists (SLPs) were working in the United States as of May 2024.  More than 12,000 of those employed in the U.S. as SLPs resided in the seven-state Great Plains region.  BLS data indicated that the region is one of the weakest in the country for speech language pathologist pay, as no state in the region registered a SLP annual mean wage level above the national average.  Moreover, three Great Plains states ranked among the ten worst states in the country for SLP annual mean wages.  More examination of BLS data from May 2024 reveals the following details about speech language pathologist pay in the Great Plains region:

Speech Language Pathologist Pay in the Great Plains Region

State # Employed Annual Mean Wages Wage Rank*
IA 1,390 $85,230 32nd
KS 1,790 $84,230 36th
MN 3,730 $82,020 42nd
MO 2,700 $84,930 33rd
NE 1,230 $83,880 38th
ND 670 $73,950 48th
SD 510 $69,230 50th
U.S. 173,910 $91,089 -------

(*) annual mean wage ranking among the 50 states and the District of Columbia

Source: U.S. Bureau of Labor Statistics OES. Data extracted on June 3, 2025

Saturday, May 31, 2025

The Dental Care Shortfall in the Southeast

March 31, 2025, data from the Health Resources and Services Administration (HRSA) revealed that more than 59.7 million Americans lived in communities or settings designated as dental health professional shortage areas (HPSA).  This designation is given to population groups, geographic areas, or facilities where with access to dental care is limited because too few dentists serve the HPSA relative to the size of its population.  Southeastern U.S dental HPSA's were home to over 22.7 million residents, accounting for just over 38% of the entire U.S. population that lived in dental care shortfall areas.  The HRSA estimates that HPSAs in the Southeast would need 4,018 more dentists in order to eliminate the dental care shortfall in the region.  Here is a state-level summary of the Southeast's dental care shortfall:

The Dental Care Shortfall in the Southeast

The Dental Care Shortfall in the Southeast

State (1) HPSAs (2) Population (3) Shortfall
AL 89 751,675 137
AR 132 580,085 103
FL 274 5,911,481 1,259
GA 184 1,963,457 411
KY 208 922,811 209
LA 163 1,869,995 252
MS 148 1,401,634 178
NC 189 2,911,480 576
SC 90 1,557,360 221
TN 143 1,941,163 314
VA 131 2,182,344 223
WV 117 749,549 135
Region 1,868 22,743,034 4,018
U.S. 7,054 59,718,174 10,143

(1) Designated Geographic, Population Group, and Facility HPSAs with a dental care shortfall
(2) Population of designated HPSAs
(3) Dental Care practitioners needed to remove HPSA Designation

Source:  Designated HPSA Quarterly Summary, 3/31/25 (HRSA)

Friday, May 30, 2025

Dental Assistant Pay in the Southwestern U.S.

May 2024 data from the U.S. Bureau of Labor Statistics (BLS) reported dental assistant employment in the United States at more than 287,780.  The four-state Southwestern U.S. accounted for roughly 48,200 of those dental assistant jobs.  BLS data revealed the Southwestern U.S. to be a rather weak one for dental assistant pay, as only one state in the region registered a mean annual wage level for dental assistants that was better than the profession's national average of $48,225.  Moreover, all other states in the region ranked among the fifteen worst states in the nation for dental assistant mean annual wage levels. A deeper dive into May 2024 BLS data reveals the following details about dental assistant pay in the Southwestern U.S.:

Dental Assistant Pay in the Southwestern U.S.

Dental Assistant Pay in the Southwestern U.S.


State # Employed Mean Annual Wage Wage Rank*
AZ 7,480 $50,040 17th
NM 2,010 $42,290 43rd
OK 4,540 $42,980 39th
TX 31,360 $42,520 41st
U.S. 287,780 $48,225 -------

(*) annual mean wage ranking among the 50 states and the District of Columbia

Source: U.S. Bureau of Labor Statistics OES. Data extracted on May 30, 2025

Wednesday, May 28, 2025

Clinical Lab Tech Pay in the Great Lakes Region

The U.S. Bureau of Labor Statistics (BLS) published data recently that put clinical laboratory technician and technologist employment at over 337,000 as of May 2024.  Just over 49,000 clinical lab tech positions were in the five-state Great Lakes region at that time.  For clinical lab techs, the Great Lakes region was a subpar one in terms of pay relative to the national average.  More than 77% of clinical lab techs in the region lived in one of the four Great Lakes region states where the annual mean wage for clinical lab techs lagged the national average. A closer review of BLS data from May 2024 yielded the following details about clinical lab tech pay in the Great Lakes region:

Clinical Lab Tech Pay in the Great Lakes Region

Clinical Lab Tech Pay in the Great Lakes Region

State # Employed Annual Mean Wages Wage Rank*
IL 11,200 $68,680 16th
IN 8,610 $58,450 39th
MI 9,220 $60,650 32nd
OH 13,160 $62,730 27th
WI 6,960 $64,470 23rd
U.S. 337,740 $65,012 -------

(*) annual mean wage ranking among the 50 states

Source: U.S. Bureau of Labor Statistics OES. Data extracted on May 28, 2025

Monday, May 26, 2025

The Mental Health Care Shortfall in the Great Lakes Region

A mental health HPSA (health professional shortage area) is a facility, geographic unit, or population group designated by the Health Resources and Services Administration (HRSA) as having substandard availability of basic mental health care services. This designation reflects there being too few mental health care practitioners serving the community relative to the size of the population.  As of March 31, 2025, the HRSA reported that nearly 122.4 million Americans lived in a mental health care shortage area.

As of March 31, 2025, more than 21.6 million residents of the five-state Great Lakes region lived in a mental health care shortage area.  To eliminate that shortfall, the HRSA estimates that Great Lakes region HPSA's would need 923 additional mental health care providers servicing these communities.  A state-level examination of 3/31/25 HRSA data reveals the following about the mental health care shortfall in the Great Lakes region:

The Mental Health Care Shortfall in the Great Lakes Region

The Mental Health Care Shortfall in the Great Lakes Region

State (1) HPSAs (2) Population (3) Shortfall
IL 211 6,540,212 291
IN 100 5,065,898 211
MI 233 3,690,930 144
OH 135 4,763,137 207
WI 168 1,574,202 70
Region 847 21,634,379 923
U.S. 6,418 122,383,988 6,202

(1) HRSA-designated Geographic Units, Population Groups, and Facilities with a mental health care shortfall
(2) Population of designated HPSAs
(3) Mental Health Care practitioners needed to remove HPSA Designation

Source:  Designated HPSA Quarterly Summary, March 31, 2025 (HRSA)

Saturday, May 24, 2025

The Primary Care Shortfall in New England

A geographic area, facility, or population unit where individuals have substandard access to basic medical care because there are too few primary care physicians relative to the community's population size can be designated a primary care HPSA (health professional shortage area) by the Health Resources and Services Administration (HRSA).  As of March 31, 2025, more than 77.2 million Americans lived in primary care HPSAs.  This included 1.5 million people who lived in the six-state New England region.  The HRSA estimates that to eliminate this primary care shortage, New England HPSAs would need 188 more primary care physicians.  A closer study of 3/31/25 HRSA data reveals the following state-level breakdown of the primary care shortfall in New England:

The Primary Care Shortfall in New England

The Primary Care Shortfall in New England

State (1) HPSAs (2) Population (3) Shortfall
CT 46 694,859 53
MA 61 471,369 94
ME 76 85,155 18
NH 22 112,513 10
RI 13 137,033 13
VT 13 1,580 0
Region 231 1,502,509 188
U.S. 7,749 77,253,848 13,364

(1) HRSA-designated Geographic Units, Population Groups, and Facilities with a primary care shortfall
(2) Population of designated HPSAs
(3) Primary Care practitioners needed to remove the HPSA Designation

Source:  Designated HPSA Quarterly Summary, 3/31/25 (HRSA)

Tuesday, May 20, 2025

Nurse Practitioner Pay in the U.S. Southeast

Earlier this summer the U.S. Bureau of Labor Statistics (BLS) reported that more than 303,000 nurse practitioners (NPs) were employed in the United States as of May 2024.  The twelve-state U.S. Southeast accounted for 93,630 NP jobs in May 2024.  The U.S. Southeast region is the weakest in the nation for nurse practitioner pay.  The average NP annual mean wage in every state in the region is below the national average, and the region is home to seven of the ten worst states in the nation for nurse practitioner annual mean wages.  A further examination of BLS data from May 2024 shows the following about nurse practitioner pay in the U.S. Southeast:

Nurse Practitioner Pay in the U.S. Southeast

State # Employed Annual Mean Wages Wage Rank*
AL 4,730 $109,650 48th
AR 3,350 $116,030 46th
FL 24,690 $128,340 24th
GA 10,580 $125,490 35th
KY 4,710 $116,930 45th
LA 4,480 $124,850 36th
MS 4,170 $122,930 39th
NC 8,020 $124,830 37th
SC 5,850 $113,950 47th
TN 14,300 $108,180 49th
VA 6,470 $122,180 41st
WV 2,280 $122,140 42nd
U.S. 303,410 $130,077 -------

(*) annual mean wage ranking among the 50 states and the District of Columbia

Source: U.S. Bureau of Labor Statistics OES. Data extracted on May 20, 2025

Monday, May 19, 2025

The Dental Care Shortfall in the Far Western U.S.

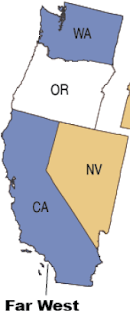
March 31, 2025, data available from the Health Resources and Services Administration (HRSA) indicated that over 59.7 million Americans lived in areas designated as dental health professional shortage areas (HPSA).  A dental health HPSA is a population group, geographic unit, or facility where the community has poor access to basic dental care because not enough dentists serve the area relative to the HPSA's population.  HPSAs in the six-state Far Western U.S. had more than 7 million residents who lived in dental care shortage areas.  The HRSA estimates that HPSAs in the Far West would need more than 1,000 additional dentists in order to eliminate the dental care shortfall in the region.  From the HRSA's March 31, 2025, data, here is a state-level summary of the dental care shortfall in the Far Western U.S.:

The Dental Care Shortfall in the Far Western U.S.

The Dental Care Shortfall in the Far Western U.S.

State (1) HPSAs (2) Population (3) Shortfall
AK 339 411,622 59
CA 529 2,740,227 427
HI 32 196,213 33
NV 65 797,261 154
OR 137 1,029,448 158
WA 192 1,908,466 194
Region 1,294 7,083,237 1,025
U.S. 7,054 59,718,174 10,143

(1) HRSA-designated Geographic Units, Population Groups, and Facilities with a dental care shortfall
(2) Population of designated HPSAs
(3) Dental Care practitioners needed to remove HPSA Designation

Source:  Designated HPSA Quarterly Summary, 3/31/25 (HRSA)

Saturday, May 17, 2025

The Mental Health Care Shortfall in the Southwest

Geographic units, population groups, and facilities where residents have substandard access to mental health care services can be designated as a health professional shortage area (HPSA) by the Health Resources and Services Administration (HRSA).  This designation can be based on either the size of the HPSA's population relative to (a) the number of psychiatrists that serve the community, or (b) the combined number of psychiatrists, clinical social workers, clinical psychologists, and certain other types of mental health care practitioners who service the area.  A shortfall indicates that the number of actual practitioners serving the HPSA is lower than what would be expected for the number of residents living in the designated area.

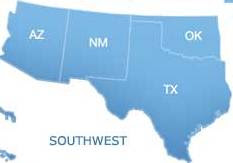
Based on March 31, 2025 HRSA data, nearly 122.4 million Americans lived in mental health HPSAs.  That included 18.7 million residents of the four-state U.S. Southwest.  To eliminate the mental health care shortfall in the Southwest, the HRSA estimated that an additional 937 mental health care practitioners would be needed to service mental health HPSAs in the region.  A state-level look at HRSA data as of March 31, 2025 reveals the following about the mental health care shortfall in the Southwest:

The Mental Health Care Shortfall in the Southwest

The Mental Health Care Shortfall in the Southwest


State (1) HPSAs (2) Population (3) Shortfall
AZ 206 2,074,757 144
NM 96 1,362,121 73
OK 129 1,911,019 106
TX 382 13,394,834 614
Region 813 18,742,731 937
U.S. 6,418 122,383,988 6,202

(1) HRSA-designated Geographic Units, Population Groups, and Facilities with a mental health care shortfall
(2) Population of designated HPSAs
(3) Mental Health Care practitioners needed to remove HPSA Designation

Source:  Designated HPSA Quarterly Summary, March 31, 2025 (HRSA)

Friday, May 16, 2025

Family Medicine Physician Pay in the Southwest

Information published earlier this year by the U.S. Bureau of Labor Statistics (BLS) put the number of employed family medicine physicians in the U.S. at more than 104,000 as of May 2024.  According to BLS data, the four-state Southwest U.S. region is a standout for family medicine pay, employing about 13,800 physicians in the field. Each state in the region reported annual mean wages at or above the national average, with New Mexico and Arizona both placing in the top ten for highest-paying states. A closer review of May 2024 BLS data details the following about family medicine physician pay in the Southwest:

Family Medicine Physician Pay in the Southwest

Family Medicine Physician Pay in the Southwest


State # Employed Annual Mean Wages Wage Rank*
AZ 3,820 $306,890 3rd
NM 710 $291,980 8th
OK 2,780 $253,090 26th
TX 6,510 $270,420 16th
U.S. 104,780 $253,047 -------

(*) annual mean wage ranking among the 50 states and the District of Columbia

Source: U.S. Bureau of Labor Statistics OES. Data extracted on May 16, 2025

Monday, May 12, 2025

The Ten Largest General Hospitals in Ohio

Based on Fourth Quarter 2024 Medicare Provider of Services file certified bed count data, the ten largest general hospitals in Ohio are:


Saturday, May 10, 2025

The Ten Largest General Hospitals in Florida

Certified bed count data from the Fourth Quarter 2024 Medicare Provider of Services file reveal the following to be the ten largest general hospital providers in Florida:


Friday, May 9, 2025

Speech Language Pathologist Pay in New England

U.S. Bureau of Labor Statistics (BLS) employment data released earlier this year reported nearly 173,910 speech language pathologists (SLPs) at work in the United States as of May 2024.  About 9,840 SLPs were employed in the six-state New England region according to the BLS data.  New England is a relatively good region for speech language pathologist pay, notwithstanding the fact that Maine and Vermont ranked among the ten worst states in the country for SLP annual mean wages. Despite the poor pay environment in those states, 80% of SLPs in New England lived in one of three states in the region that ranked among the fifteen best states in the nation for speech language pathologist annual mean wage levels. A closer review of May 2024 BLS data reveals the following details about speech language pathologist pay in New England:

Speech Language Pathologist Pay in New England

Speech Language Pathologist Pay in New England

State # Employed Annual Mean Wages Wage Rank*
CT 2,160 $103,460 8th
MA 5,000 $99,570 13th
ME 610 $80,100 44th
NH 790 $86,900 29rd
RI 810 $100,40 12th
VT 470 $81,890 43rd
U.S. 173,910 $91,089 -------

(*) annual mean wage ranking among the 50 states and the District of Columbia

Source: U.S. Bureau of Labor Statistics OES. Data extracted on May 9, 2025

Wednesday, May 7, 2025

Clinical Lab Tech Pay in the Far Western U.S.

More than 337,000 clinical laboratory technicians and technologists were working in the United States as of May 2024 according to the most recent occupational employment data released by the U.S. Bureau of Labor Statistics (BLS).  Just under 44,500 of the nation's employed clinical lab techs were working in the six-state Far Western U.S. region.  For clinical lab techs, the Far West was one of the very best regions in the nation in terms of pay.  Nearly every state in the region had an average annual mean wage level for clinical lab techs that topped the national average. Moreover, three states in the region ranked in the top 10 nationally for clinical lab tech annual mean wages.  A closer examination of BLS data from May 2024 reveals the following details about clinical lab tech pay in the Far Western U.S.:

Clinical Lab Tech Pay in the Far Western U.S.

Clinical Lab Tech Pay in the Far Western U.S.

State # Employed Annual Mean Wages Wage Rank*
AK 700 $71,590 12th
CA 29,460 $76,690 6th
HI 1,260 $70,030 14th
NV 2,270 $63,600 24th
OR 3,020 $78,530 4th
WA 7,740 $73,280 10th
U.S. 337,740 $65,012 -------

(*) annual mean wage ranking among the 50 states and the District of Columbia

Source: U.S. Bureau of Labor Statistics OES. Data extracted on May 7, 2025

Monday, May 5, 2025

Dental Assistant Pay in the Great Plains Region

Data released recently from the U.S. Bureau of Labor Statistics (BLS) reported that, as of May 2024, more than 287,000 dental assistants were working in the United States.  About 24,000 dental assistants at work in May 2024 lived in the seven-state Great Plains region of the country.  BLS data reveals much disparity in the Great Plains region for dental assistant pay.  Dental assistants in Minnesota enjoy the highest average annual mean wage in the country, and North Dakota is another top 10 state for dental assistant annual mean wages.  However, about 53% of the region's dental assistants work in one of three states that rank 31st or worse for average annual mean wages for the profession.  A deeper dive into May 2024 BLS data details the following about dental assistant pay in the Great Plains region of the U.S.:

Dental Assistant Pay in the Great Plains Region

Dental Assistant Pay in the Great Plains Region

State # Employed Annual Mean Wages Wage Rank*
IA 3,540 $49,020 24th
KS 3,020 $42,490 42nd
MN 5,590 $63,680 1st
MO 7,380 $45,390 37th
NE 2,360 $46,300 31st
ND 920 $54,720 7th
SD 1,240 $49,080 23rd
U.S. 287,780 $48,225 -------

(*) annual mean wage ranking among the 50 states and the District of Columbia

Source: U.S. Bureau of Labor Statistics OES. Data extracted on May 5, 2025