Wednesday, November 30, 2022

Ten States with the Highest Cancer Death Rates

More than 602,300 Americans died of cancer in 2020, making it the second leading cause of death in the United States, after only heart disease. An examination of 2020 state-level data from the National Center for Health Statistics revealed the following to be the:

Ten States with the Highest Cancer Death Rates

State/Deaths Deaths Population Death Rate*
West Virginia 4,725 1,784,787 264.7
Maine 3,432 1,350,141 254.2
Kentucky 10,181 4,477,251 227.4
Vermont 1,400 623,347 224.6
Mississippi 6,582 2,966,786 221.9
Pennsylvania 27,955 12,783,254 218.7
Delaware 2,141 986,809 217.0
Arkansas 6,496 3,030,522 214.4
Ohio 24,863 11,693,217 212.6
Alabama 10,456 4,921,532 212.5
     Total 98,231 44,617,646 220.2
U.S. 602,350 329,484,123 182.8

(*) number of cancer deaths per 100,000 population

Source: CDC Wonder. Centers for Disease Control and Prevention, National Center for Health Statistics. Underlying Cause of Death 1999-2020 on CDC WONDER Online Database, released in 2021. Data are from the Multiple Cause of Death Files, 1999-2020, as compiled from data provided by the 57 vital statistics jurisdictions through the Vital Statistics Cooperative Program. Accessed on November 25,2022

related commentary: Regional Cancer Death Rates in the U.S.
Tuesday, November 29, 2022

20 Best Metro Areas for Pharmacy Technician Pay

As examined in Pharmacy Technician Pay in the Top 20 Metropolitan Areas last October, the largest U.S. metropolitan markets are top centers for pharmacy technician employment. Nonetheless, a deeper look at U.S. Bureau of Labor Statistics (BLS) data reveals that smaller metro areas frequently provide pharmacy technicians with better pay opportunities.  A review of May 2021 BLS data shows us that just four of the top 20 U.S. metropolitan areas were among the 20 best metro areas for pharmacy technician pay:

20 Best Metro Areas for Pharmacy Technician Pay

Metropolitan Area # Employed Annual Mean Wages
1 San Francisco-Oakland-Hayward (#) 4,280 $59,340
2 Napa, CA 160 $58,620
3 San Jose-Sunnyvale-Santa Clara, CA 2,010 $58,390
4 Vallejo-Fairfield, CA 430 $57,060
5 Santa Rosa, CA 360 $56,590
6 Sacramento--Roseville--Arden-Arcade 2,630 $51,520
7 Stockton-Lodi, CA 700 $50,860
8 Salinas, CA 330 $49,570
9 San Diego-Chula Vista-Carlsbad (#) 3,230 $48,960
10 Seattle-Tacoma-Bellevue (#) 4,290 $48,850
11 Hanford-Corcoran, CA 130 $48,130
12 San Luis Obispo-Paso Robles, CA 270 $48,070
13 Los Angeles-Long Beach-Anaheim (#) 13,770 $48,010
14 Santa Cruz-Watsonville, CA 240 $48,000
15 Oxnard-Thousand Oaks-Ventura, CA 730 $47,700
16 Redding, CA 190 $47,660
17 Olympia-Tumwater, WA 280 $47,490
18 Northern Valley California non-metro 200 $47,440
19 Alaska non-metro 200 $47,400
20 Santa Maria-Santa Barbara, CA 390 $47,370
National 436,630 $37,970

(#) a top 20 U.S metro population area

Source: U.S. Bureau of Labor Statistics OES. Data extracted on November 28, 2022

Monday, November 28, 2022

20 Best Metropolitan Areas for Clinical Lab Tech Pay

Last October we took a look at Clinical Lab Tech Pay in the Top 20 Metro Markets.  U.S. Bureau of Labor Statistics (BLS) data reveals that, without question, the biggest population metro areas are major employment centers for clinical lab technologists and technicians. However, a deeper dive into the BLS data makes it clear that clinical lab techs employed in smaller metro markets very often attain better compensation levels than their larger market counterparts. In fact, May 2021 data from the BLS reveals that only two of the 20 largest metro markets in the U.S. were among the 20 best metropolitan areas for clinical lab tech pay:

20 Best Metropolitan Areas for Clinical Lab Tech Pay

Metropolitan Area # Employed Annual Mean Wages
1 Redding, CA 90 $87,210
2 Napa, CA 50 $86,260
3 Merced, CA 50 $82,560
4 Northern Valley California non-metro 120 $81,510
5 San Jose-Sunnyvale-Santa Clara, CA 1,370 $77,150
6 San Francisco-Oakland-Hayward (#) 4,380 $76,330
7 North Coast California non-metro 120 $76,020
8 Coast Oregon non-metro 160 $73,880
9 Massachusetts non-metro 60 $73,440
10 Sacramento--Roseville--Arden-Arcade 1,830 $73,290
11 Bend-Redmond, OR 90 $73,280
12 New York-Newark-Jersey City (#) 18,400 $72,930
13 Norwich-New London-Westerly, CT-RI 220 $72,870
14 Bridgeport-Stamford-Norwalk, CT 870 $72,270
15 Santa Rosa, CA 360 $72,140
16 Hartford-West Hartford-East Hartford 980 $71,900
17 Stockton-Lodi, CA 310 $71,900
18 Salinas, CA 180 $71,850
19 Santa Maria-Santa Barbara, CA 240 $71,460
20 Western Washington non-metro 160 $70,910
National 318,780 $56,910

(#) a top 20 U.S metro population area

Source: U.S. Bureau of Labor Statistics OES. Data extracted on November 25, 2022

Sunday, November 27, 2022

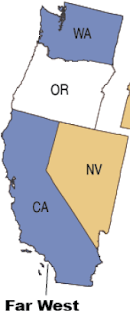
The Ten Largest Hospitals in the Far West

Based on certified bed count data from the Third Quarter, 2022 Medicare Provider of Services file, the following are the ten largest hospitals in the Far West region of the United States:

The Ten Largest Hospitals in the Far West

The Ten Largest Hospitals in the Far West

  1. LAC+USC Medical Center
    Location:  Los Angeles
    Certified Bed Count:  1,395

  2. Santa Clara Valley Medical Center
    Location:  San Jose, CA
    Certified Bed Count:  1,182

  3. UCSF Medical Center
    Location:  San Francisco
    Certified Bed Count:  1,019

  4. Sharp Memorial Hospital
    Location:  San Diego
    Certified Bed Count:  881

  5. Cedars-Sinai Medical Center
    Location:  Los Angeles
    Certified Bed Count:  848

  6. Community Regional Medical Center
    Location:  Fresno, CA
    Certified Bed Count:  794

  7. Sunrise Hospital and Medical Center
    Location:  Las Vegas, NV
    Certified Bed Count:  762

  8. Scripps Mercy Hospital
    Location:  San Diego
    Certified Bed Count:  700

  9. Swedish Medical Center
    Location:  Seattle, WA
    Certified Bed Count:  697

  10. Kaiser Foundation Hospital - Zion
    Location:  San Diego, CA
    Certified Bed Count:  659


Saturday, November 26, 2022

Ten States with the Lowest Cancer Death Rates

The U.S. recorded over 602,300 cancer deaths in 2020.  At about 182.8 deaths per 100,000 population, in 2020 cancer was the second leading cause of death in the United States, trailing only heart disease. 2020 state-level data from the National Center for Health Statistics, a unit of the CDC, revealed the following to be the:

Ten States with the Lowest Cancer Death Rates

State/Deaths Deaths Population Death Rate*
New York 32,955 19,336,776 170.4
Georgia 17,827 10,710,017 166.5
Washington 12,796 7,693,612 166.3
Idaho 3,004 1,826,913 164.4
California 59,778 39,368,078 151.8
Texas 42,142 29,360,759 143.5
Alaska 1,043 731,158 142.7
Colorado 8,252 5,807,719 142.1
District of Columbia 984 712,816 138.0
Utah 3,460 3,249,879 106.5
     Total 182,241 118,797,727 153.4
U.S. 602,350 329,484,123 182.8

(*) number of cancer deaths per 100,000 population

Source: CDC Wonder. Centers for Disease Control and Prevention, National Center for Health Statistics. Underlying Cause of Death 1999-2020 on CDC WONDER Online Database, released in 2021. Data are from the Multiple Cause of Death Files, 1999-2020, as compiled from data provided by the 57 vital statistics jurisdictions through the Vital Statistics Cooperative Program. Accessed on November 25,2022

related commentary: Regional Cancer Death Rates in the U.S.

Friday, November 25, 2022

20 Best Metropolitan Markets for Healthcare Social Worker Pay

In an October commentary, we discussed Healthcare Social Worker Pay in the Top 20 Metro Areas.  U.S. metropolitan areas with the largest populations naturally employ far more healthcare social workers than do smaller metro areas. However, for healthcare social workers interested in maximizing their earnings potential, better compensation opportunities may await in smaller metro markets. According to May 2021 data from the U.S. Bureau of Labor Statistics (BLS), only two of the 20 largest metro areas in the U.S. were among the 20 best metropolitan markets for healthcare social worker pay:

20 Best Metropolitan Markets for Healthcare Social Worker Pay

Metropolitan Area # Employed Annual Mean Wages
1 San Jose-Sunnyvale-Santa Clara 720 $105,600
2 Santa Rosa, CA 150 $100,890
3 San Francisco-Oakland-Hayward (#) 1,920 $98,340
4 Vallejo-Fairfield, CA 120 $96,170
5 Sacramento--Roseville--Arden-Arcade 880 $91,270
6 Salinas, CA 120 $90,840
7 Yuba City, CA 40 $88,510
8 Modesto, CA 190 $87,880
9 Napa, CA 50 $83,860
10 Fresno, CA 280 $81,840
11 Los Angeles-Long Beach-Anaheim (#) 4,320 $81,660
12 Santa Cruz-Watsonville, CA 110 $80,990
13 Portland-Vancouver-Hillsboro, OR-WA 1,260 $80,870
14 San Luis Obispo-Paso Robles, CA 60 $80,400
15 Massachusetts non-metro 240 $79,860
16 Salem, OR 160 $79,190
17 Oxnard-Thousand Oaks-Ventura, CA 230 $79,080
18 Stockton-Lodi, CA 230 $78,860
19 Eugene, OR 180 $78,320
20 Bridgeport-Stamford-Norwalk, CT 350 $78,070
National 173,860 $62,310

(#) a top 20 U.S metro population area

Source: U.S. Bureau of Labor Statistics OES. Data extracted on November 19, 2022

Thursday, November 24, 2022

20 Best Metro Markets for Nurse Practitioner Pay

In a commentary in October, we reviewed Nurse Practitioner Pay in the Top 20 Metropolitan Markets.  As is the case with most healthcare professions, the major metropolitan areas in the U.S. are big centers for nurse practitioner employment.  However, it is in smaller metro markets, not the large ones, where nurse practitioners oftentimes find better average compensation levels. This is readily evident in May 2021 data from the U.S. Bureau of Labor Statistics (BLS), which reveals that only three of the 20 largest metro areas in the nation were among the 20 best metro markets for nurse practitioner pay:

20 Best Metro Markets for Nurse Practitioner Pay

Metropolitan Area # Employed Annual Mean Wages
1 San Jose-Sunnyvale-Santa Clara, CA 1,220 $197,870
2 Napa, CA 90 $184,700
3 Vallejo-Fairfield, CA 130 $180,380
4 San Francisco-Oakland-Hayward (#) 2,550 $177,160
5 Yuba City, CA 30 $159,260
6 San Luis Obispo-Paso Robles, CA 140 $153,300
7 Sacramento--Roseville--Arden-Arcade 900 $153,050
8 Santa Rosa, CA 180 $152,150
9 Santa Cruz-Watsonville, CA 150 $150,280
10 Fresno, CA 440 $147,760
11 Modesto, CA 270 $147,190
12 El Centro, CA 70 $147,080
13 Duluth, MN-WI 300 $146,740
14 Redding, CA 90 $146,040
15 Riverside-San Bernardino-Ontario (#) 1,300 $145,250
16 Los Angeles-Long Beach-Anaheim (#) 5,490 $144,930
17 Bakersfield, CA 320 $144,770
18 Madera, CA 90 $142,400
19 Salinas, CA 130 $142,130
20 Visalia-Porterville, CA 190 $141,650
National 234,690 $118,040

(#) a top 20 U.S metro population area

Source: U.S. Bureau of Labor Statistics OES. Data extracted on November 19, 2022

Wednesday, November 23, 2022

Top Ranked Pediatric Heart Hospitals in the Southeastern U.S.

In the current (2022-23) survey of American hospitals from U.S. News & World Report (USNWR), among the 50 hospitals recognized for being the best in the U.S. for pediatric heart care, thirteen were based in the twelve-state Southeastern region of the country.  No other region of the country had more hospitals ranked among the 50 best pediatric heart hospitals in the U.S. than did the Southeast.  While other hospitals in the Southeast may provide cardiology and heart surgery services, the thirteen hospitals that earned a spot in the USNWR national survey stand apart as the top-ranked pediatric heart hospitals in the Southeastern U.S.:

Top Ranked Pediatric Heart Hospitals in the Southeastern U.S.

Top Ranked Pediatric Heart Hospitals in the Southeastern U.S.

Location:  Charleston, SC
National Pediatric Cardiology & Heart Surgery Ranking:  #4

Duke Children's Hospital
Location: Durham, NC
National Pediatric Cardiology & Heart Surgery Ranking:  #7

Children's Healthcare of Atlanta
Location: Atlanta
National Pediatric Cardiology & Heart Surgery Ranking:  #18

Location:  Memphis, TN
National Pediatric Cardiology & Heart Surgery Ranking:  #19

Virginia Congenital Cardiac Collaborative
Location: Charlottesville, VA
National Pediatric Cardiology & Heart Surgery Ranking:  #20

Levine Children's Hospital
Location: Charlotte, NC
National Pediatric Cardiology & Heart Surgery Ranking:  #22

Location: Gainesville, FL
National Pediatric Cardiology & Heart Surgery Ranking:  #26

Children's of Alabama
Location: Birmingham, AL
National Pediatric Cardiology & Heart Surgery Ranking:  #28

National Pediatric Cardiology & Heart Surgery Ranking:  #30

Location:  New Orleans, LA
National Pediatric Cardiology & Heart Surgery Ranking:  #35

Arkansas Children’s Hospital
Location: Little Rock, AR
National Pediatric Cardiology & Heart Surgery Ranking:  #44

Nicklaus Children's Hospital
Location: Miami, FL
National Pediatric Cardiology & Heart Surgery Ranking:  #47

Location:  Hollywood, FL
National Pediatric Cardiology & Heart Surgery Ranking:  #49

For a closer look into the technical metrics used to rate pediatric heart hospitals in the 22-23 USNWR survey, or to find the pediatric heart care rating of other Southeastern region hospitals, visit Best Hospitals for Pediatric Cardiology and Heart Surgery.

Tuesday, November 22, 2022

Ten States with the Lowest Firearm Death Rates

In 2020, over 45,200 deaths in the U.S. were caused by firearm incidents.  The 2020 firearm death rate of 13.7 deaths per 100,000 population was one-third higher than the 1999 firearm death rate of 10.3 deaths per 100,000 population.  Firearm death rates at the state level varied widely with some states experiencing far worse problems with gun-related deaths than others. The ten states with the lowest firearm death rates in 2020 had a collective death rate from gun incidents that was 48% lower than the national average.  A review of state-level data from the CDC's National Center for Health Statistics revealed the following to be the ten states with the lowest firearm death rates in 2020:

Ten States with the Lowest Firearm Death Rates

State/Deaths Deaths Population Death Rate*
Nebraska 197 1,937,552 10.2
New Hampshire 128 1,366,275 9.4
Minnesota 513 5,657,342 9.1
California 3,449 39,368,078 8.8
Connecticut 219 3,557,006 6.2
New York 1,052 19,336,776 5.4
Rhode Island 54 1,057,125 5.1
New Jersey 443 8,882,371 5.0
Massachusetts 268 6,893,574 3.9
Hawaii 50 1,407,006 3.6
     Total 6,373 89,463,105 7.1
U.S. 45,222 329,484,123 13.7

(*) number of firearm deaths per 100,000 population

Source: CDC Wonder. Centers for Disease Control and Prevention, National Center for Health Statistics. Underlying Cause of Death 1999-2020 on CDC WONDER Online Database, released in 2021. Data are from the Multiple Cause of Death Files, 1999-2020, as compiled from data provided by the 57 vital statistics jurisdictions through the Vital Statistics Cooperative Program. Accessed on November 16, 2022

related commentary:  Regional Gun Death Rates in the U.S.

Sunday, November 20, 2022

20 Best Metropolitan Markets for Nursing Assistant Pay

In Nursing Assistant Pay in the Top 20 Metro Markets, we learned that the major U.S. metro areas are big employment centers for nursing assistants. However, a more thorough examination of data from the U.S. Bureau of Labor Statistics (BLS) reveals that better pay, sometimes a lot better, for nursing assistants is often found in smaller population centers. May 2021 (BLS) data indicates that only six of the top 20 U.S. metro areas were among the 20 best metropolitan markets for nursing assistant pay:

20 Best Metropolitan Markets for Nursing Assistant Pay

Metropolitan Area # Employed Annual Mean Wages
1 San Jose-Sunnyvale-Santa Clara, CA 4,940 $47,690
2 San Francisco-Oakland-Hayward (#) 10,220 $47,500
3 Alaska non-metro 570 $45,430
4 Salinas, CA 810 $44,210
5 Fairbanks, AK 190 $43,880
6 Napa, CA 550 $42,310
7 New York-Newark-Jersey City (#) 81,890 $41,940
8 Anchorage, AK 1,000 $41,580
9 Santa Cruz-Watsonville, CA 310 $41,070
10 Santa Rosa, CA 1,010 $40,770
11 Seattle-Tacoma-Bellevue (#) 13,850 $40,590
12 Salem, OR 1,210 $40,560
13 Sacramento--Roseville--Arden-Arcade 4,630 $39,910
14 Portland-Vancouver-Hillsboro, OR-WA 7,430 $39,590
15 Vallejo-Fairfield, CA 870 $39,520
16 Santa Maria-Santa Barbara, CA 1,040 $38,990
17 Boston-Cambridge-Nashua (#) 26,580 $38,880
18 Minneapolis-St.Paul-Bloomington (#) 13,160 $38,750
19 Los Angeles-Long Beach-Anaheim (#) 38,030 $38,690
20 Northern Valley California non-metro 670 $38,610
National 1,314,830 $33,250

(#) a top 20 U.S metro population area

Source: U.S. Bureau of Labor Statistics OES. Data extracted on November 16, 2022