Wednesday, June 30, 2021

Michigan Medicine, Our Trusted Link for June, 2021


University of Michigan Health

The University of Michigan healthcare system, headquartered in Ann Arbor, is known as Michigan Medicine. It is ranked #11 on the U. S. News Best Hospitals Honor Roll. For the state of Michigan, it's ranked the #1 hospital, and it also ranks high for 13 adult and 10 children's specialties. 

The University of Michigan Medical School accepted its initial class in 1850, and in 1869 opened the first university-owned hospital in the U. S. On the U. of Michigan campus, the Medical Center contains the main hospital as well several specialty hospitals. Michigan Medicine also operates around 40 health centers around southeast Michigan. It employs over 20,000 people, including 3,500 on the academic staff. 

In 1887, University of Michigan opened the Hygienic Laboratory, the first purpose-built place in the U.S. for studying bacteria, assisting in public health issues. In 1902 the nation’s first Department of Bacteriology was established there. 

The faculty of the Medical School were among the first to experiment with radiology, and in 1913 appointed the first professor of roentgenology (now radiology) in the U. S. 

Other pioneering steps at Michigan Medicine include

  • 1905: the first Dermatology department in the U. S. 
  • 1906: an early Psychiatry department
  • 1913: introduction of the EKG to American physicians
  • 1922: the first hospital school for child patients
  • 1926: a research institute for blood-related diseases
  • 1928: world’s first successful lung removal
  • 1934: first statistical department, for recording and providing access to patient data
  • 1940: first U.S. human genetics program with a clinic for hereditary diseases
  • 1959: first hospital gift shop, run by volunteers and providing grants for patients from the proceeds
  • 1975: one of the first PhD programs in nursing research
  • 2001: nation's first comprehensive Depression Center

Specialties and Institutions

The Rogel Cancer Center has been recognized as a Comprehensive Cancer Center by the National Cancer Institute since 1991. In 2018, $150 million was donated by Richard and Susan Rogel to support both cancer patients and cancer researchers. The program stands out for its multidisciplinary approach and sharing of resources. 

Cancer AnswerLine

Tuesday, June 29, 2021

Cancer Deaths in the Great Plains Region

Cancer is the number two cause of death in America, accounting for over 599,000 deaths in 2019, or about 21% of all deaths in the United States that year.  Thanks to improvements in medical knowledge, the cancer death rate has dropped modestly over the past twenty years. Whereas in 1999 the U.S. recorded 197.0 cancer deaths per 100,000 population, by 2019 the cancer death rate had dropped to 182.7 deaths per 100,000 population.  The national trend in cancer deaths is also seen in the seven-state Great Plains region of the country.  Although a region where the cancer death rate historically runs above the national average, the Great Plains region also saw its cancer death rate drop between 1999 and 2019, from 204.7 deaths per 100,000 population to 193.2 deaths per 100,000 population.  A closer review of data from the Centers for Disease Control and Prevention, National Center for Health Statistics, reveals the following about cancer deaths in the Great Plains region of the country:

Cancer Deaths in the Great Plains Region

Area/Deaths 1999 2009 2019
IA 6,346 6,249 6,335
KS 5,334 5,319 5,619
MN 8,892 9,580 10,042
MO 12,186 12,472 12,873
NE 3,410 3,336 3,482
ND 1,366 1,243 1,316
SD 1,632 1,503 1,737
Region 39,166 39,702 41,404
U.S. 549,838 567,628 599,601
Area/Death Rate* 1999 2009 2019
IA 217.5 206.0 200.8
KS 199.2 187.8 192.9
MN 182.5 181.4 178.1
MO 219.1 209.2 209.7
NE 200.0 184.0 180.0
ND 212.0 186.9 172.7
SD 217.5 186.2 196.3
Region 204.7 194.7 193.2
U.S. 197.0 185.0 182.7

(*) number of cancer deaths per 100,000 population

Source: CDC Wonder. Centers for Disease Control and Prevention, National Center for Health Statistics. Underlying Cause of Death 1999-2019 on CDC WONDER Online Database, released in 2020. Data are from the Multiple Cause of Death Files, 1999-2019, as compiled from data provided by the 57 vital statistics jurisdictions through the Vital Statistics Cooperative Program. Accessed on June 12, 2021

Tuesday, June 22, 2021

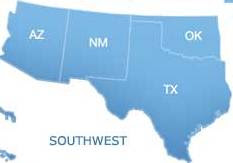
Heart Disease Deaths in the Southwest

Heart disease is the number one cause of death in U.S., accounting for more than 659,000 deaths in 2019, or about 23% of all deaths in the United States that year.  Advances in medical knowledge have contributed significantly to a decline in the heart disease death rate over the past twenty years. From 259.9 deaths per 100,000 population in 1999, by 2019 the heart disease death rate had dropped to 200.8 deaths per 100,000 population.  Even so, the heart disease death rate nationally has been creeping back up since the middle of the last decade.  The national experience with heart disease deaths is mirrored in the U.S. Southwest, where the 2019 death rate of 174.7 per 100,000 population was nearly 22% lower than it was in 1999.  A deeper look at data from the Centers for Disease Control and Prevention, National Center for Health Statistics, reveals the following about the trend in heart disease deaths in the Southwest region of the United States:

Heart Disease Deaths in the Southwest

Heart Disease Deaths in the Southwest


Area/Deaths 1999 2009 2019
AZ 10,800 10,273 12,587
NM 3,452 3,214 4,245
OK 11,263 9,202 10,960
TX 43,418 38,077 46,139
Region 68,933 60,766 73,931
U.S. 725,192 599,413 659,041
Area/Death Rate* 1999 2009 2019
AZ 215.0 162.0 172.9
NM 190.9 157.8 202.4
OK 327.7 247.5 277.0
TX 211.2 153.5 159.1
Region 223.6 164.7 174.7
U.S. 259.9 195.4 200.8

(*) number of heart disease deaths per 100,000 population

Source: CDC Wonder. Centers for Disease Control and Prevention, National Center for Health Statistics. Underlying Cause of Death 1999-2019 on CDC WONDER Online Database, released in 2020. Data are from the Multiple Cause of Death Files, 1999-2019, as compiled from data provided by the 57 vital statistics jurisdictions through the Vital Statistics Cooperative Program. Accessed on June 9, 2021

Sunday, June 20, 2021

Drug Induced Deaths in New England

There were over 74,500 drug induced deaths in the United States in 2019, or about 22.7 drug induced deaths per 100,000 population.  Drug overdoses, both intentional and accidental, accounted for almost 95% of these fatalities.  In the twenty years from 1999 to 2019, the drug induced death rate per 100,000 population more than tripled nationally.  While all regions of the country experienced sharp increases in the number of drug induced deaths in the twenty years from 1999 to 2019, the experience in the six-state New England region was particularly bad.  During the same twenty year period that the national drug induced death rate more than tripled, in New England the death rate more than quadrupled.  From a drug induced death rate per 100,000 population that was already over 11% above the national average in 1999, by 2019 the region's drug induced death rate was more than 43% above the national average rate.  A review of data from the Centers for Disease Control and Prevention, National Center for Health Statistics, reveals the following about drug induced deaths in the New England region.:

Drug Induced Deaths in New England

Drug Induced Deaths in New England

Area/Deaths 1999 2009 2019
CT 330 397 1,263
MA 512 916 2,312
ME 70 182 391
NH 62 172 420
RI 61 168 312
VT 31 57 142
Region 1,066 1,892 4,840
U.S. 19,128 39,147 74,511
Area/Death Rate* 1999 2009 2019
CT 9.7 11.1 35.4
MA 8.1 14.1 33.5
ME 5.5 13.7 29.1
NH 5.1 13.1 30.9
RI 5.9 15.9 29.5
VT 5.1 9.1 22.8
Region 7.7 13.1 32.6
U.S. 6.9 12.8 22.7

(*) number of drug induced deaths per 100,000 population

Source: CDC Wonder. Centers for Disease Control and Prevention, National Center for Health Statistics. Underlying Cause of Death 1999-2019 on CDC WONDER Online Database, released in 2020. Data are from the Multiple Cause of Death Files, 1999-2019, as compiled from data provided by the 57 vital statistics jurisdictions through the Vital Statistics Cooperative Program. Accessed on June 5, 2021

Wednesday, June 16, 2021

Firearm Deaths in the Southeastern U.S.

There were more than 39,700 firearm deaths, or about 12.1 firearm deaths per 100,000 population, in the United States in 2019.  Nationally, by 2019 the number of firearms-caused deaths per 100,000 population had increased approximately 17% and 18% from 1999 and 2009 levels, respectively.  The twelve-state Southeast region saw its firearm death rate jump from 13.6 deaths per 100,000 population in 1999 to 16.1 deaths per 100,000 population in 2019.  Already a region with a higher firearms-caused death rate than most regions of the country in 1999, by 2019 the firearm death rate (per 100,000 population) in the Southeast was 33% higher than the national average.  A closer review of data from the Centers for Disease Control and Prevention, National Center for Health Statistics, reveals the following about the trend in firearm deaths in the Southeastern U.S. over the past twenty years:

Firearm Deaths in the Southeastern U.S.

Area/Deaths 1999 2009 2019
AL 790 830 1,076
AR 388 465 580
FL 1,721 2,324 2,872
GA 1,105 1,247 1,695
KY 525 560 682
LA 779 810 1,013
MS 515 487 710
NC 1,057 1,112 1,397
SC 552 634 1,012
TN 848 966 1,270
VA 823 836 1,025
WV 250 251 300
Region 9,353 10,522 13,632
U.S. 28,874 31,347 39,707
Area/Death Rate* 1999 2009 2019
AL 17.8 17.4 21.9
AR 14.6 16.1 19.2
FL 10.9 12.5 13.4
GA 13.7 13.0 16.0
KY 13.1 13.0 15.3
LA 17.5 18.0 21.8
MS 18.2 16.5 23.9
NC 13.3 11.8 13.3
SC 13.9 13.8 19.7
TN 15.0 15.3 18.6
VA 11.8 10.5 12.0
WV 13.8 13.6 16.7
Region 13.6 13.5 16.1
U.S. 10.3 10.2 12.1

(*) number of firearm-caused deaths per 100,000 population; death count includes both intentional and unintentional fatalities caused by a firearm

Source: CDC Wonder. Centers for Disease Control and Prevention, National Center for Health Statistics. Underlying Cause of Death 1999-2019 on CDC WONDER Online Database, released in 2020. Data are from the Multiple Cause of Death Files, 1999-2019, as compiled from data provided by the 57 vital statistics jurisdictions through the Vital Statistics Cooperative Program. Accessed on June 2, 2021

Sunday, June 13, 2021

Cancer Deaths in the Far West Region

Cancer is the second leading cause of death in America, accounting for more than 599,000 deaths in 2019, or 21% of all deaths in the U.S. that year.  With advances in medical know how, the cancer death rate has dropped modestly over the past twenty years, from 197.0 deaths per 100,000 population in 1999 to 182.7 deaths per 100,000 population in 2019.  The national trend in cancer deaths is also seen in the six-state Far West region of the country.  Already a region with a cancer death rate below the national average, the cancer death rate in the Far West declined from 165.0 deaths per 100,000 population in 1999 to 158.2 deaths per 100,000 population in 2019.  A deeper examination of data from the Centers for Disease Control and Prevention, National Center for Health Statistics, reveals that the favorable trend in cancer deaths in the Far West region of the country has not been a universal experience, as both Alaska and Hawaii have seen their cancer death rates worsen over the past twenty years:

Cancer Deaths in the Far West Region

Area/Deaths 1999 2009 2019
AK 633 895 1,021
CA 53,067 55,991 59,512
HI 1,916 2,244 2,500
NV 3,556 4,461 5,434
OR 6,905 7,487 8,080
WA 10,653 11,922 12,960
Region 76,730 83,000 89,507
U.S. 549,838 567,628 599,601
Area/Death Rate* 1999 2009 2019
AK 101.3 128.1 139.6
CA 158.4 151.5 150.6
HI 158.3 166.6 176.6
NV 183.8 166.2 176.4
OR 203.5 196.6 191.6
WA 182.3 178.8 170.2
Region 165.0 159.1 158.2
U.S. 197.0 185.0 182.7

(*) number of cancer deaths per 100,000 population

Source: CDC Wonder. Centers for Disease Control and Prevention, National Center for Health Statistics. Underlying Cause of Death 1999-2019 on CDC WONDER Online Database, released in 2020. Data are from the Multiple Cause of Death Files, 1999-2019, as compiled from data provided by the 57 vital statistics jurisdictions through the Vital Statistics Cooperative Program. Accessed on June 12, 2021

Thursday, June 10, 2021

Heart Disease Deaths in the Mid-East Region

Heart disease is the leading cause of death in America, accounting for just over 659,000 deaths in 2019, or about 23% of all deaths in the U.S. that year.  With advances in medical knowledge, the incidence of death by heart disease has dropped considerably over the past twenty years, from 259.9 deaths per 100,000 population in 1999 to 200.8 deaths per 100,000 population in 2019.  That said, the heart disease death rate nationally has been creeping higher since the middle of the last decade.  The national experience with heart disease deaths is mirrored in the Mid-East region of the country.  While the heart disease death rate in the Mid-East region declined from 1999 to 2019, it did so to a greater extent than did most of the nation.  Whereas the region had a heart disease death rate per 100,000 population that was about 17% higher than the nation as a whole in 1999, by 2019 the Mid-East's heart disease death rate had dropped to only 12% above the national average.  A closer examination of data from the Centers for Disease Control and Prevention, National Center for Health Statistics, reveals the following about the trend in heart disease deaths in the Mid-East region of the country:

Heart Disease Deaths in the Mid-East Region

Heart Disease Deaths in the Mid-East Region

Area/Deaths 1999 2009 2019
DE 2,011 1,796 2,053
DC 1,652 1,288 1,187
MD 12,080 11,210 11,770
NJ 23,493 18,086 18,716
NY 58,987 47,283 43,806
PA 41,707 32,297 32,299
Region 139,930 111,960 109,831
U.S. 725,192 599,413 659,041
Area/Death Rate* 1999 2009 2019
DE 259.5 201.4 210.8
DC 289.7 217.5 168.2
MD 229.9 195.6 194.7
NJ 281.0 206.6 210.7
NY 312.4 244.9 225.2
PA 340.1 255.0 252.3
Region 303.5 233.5 224.8
U.S. 259.9 195.4 200.8

(*) number of heart disease deaths per 100,000 population

Source: CDC Wonder. Centers for Disease Control and Prevention, National Center for Health Statistics. Underlying Cause of Death 1999-2019 on CDC WONDER Online Database, released in 2020. Data are from the Multiple Cause of Death Files, 1999-2019, as compiled from data provided by the 57 vital statistics jurisdictions through the Vital Statistics Cooperative Program. Accessed on June 9, 2021

Wednesday, June 9, 2021

Surgical Technologist Pay in the Southeast

May 2020 data recently released by the U.S. Bureau of Labor Statistics (BLS) reveals that more than 107,000 people were employed as surgical technologists in the United States. With over 29,800 surgical technologists employed, the twelve-state Southeast region accounted for nearly 28% of U.S. surgical technologist employment. The Southeast is the weakest region in the country for surgical technologist pay, with Virginia being the only state in the region with an annual mean wage for surgical technologists that exceeds the national average. Moreover, eight states in the Southeast ranked in the bottom ten nationally for surgical technologist annual mean wages. From May 2020 BLS data, here is a summary look at surgical technologist pay in the Southeast:

Surgical Technologist Pay in the Southeast

State # Employed Annual Mean Wages Wage Rank*
AL 1,810 $38,660 51st
AR 1,290 $42,390 47th
FL 7,720 $46,710 34th
GA 3,400 $47,980 31st
KY 1,820 $44,180 44th
LA 1,980 $42,140 48th
MS 1,110 $41,520 49th
NC 3,210 $45,490 39th
SC 2,300 $43,880 45th
TN 2,250 $44,540 43rd
VA 2,080 $52,160 18th
WV 890 $39,890 50th
U.S. 107,400 $51,510 -------

(*) annual mean wage ranking among the 50 states and the District of Columbia

Source: U.S. Bureau of Labor Statistics OES. Data extracted on June 7, 2021

Tuesday, June 8, 2021

Drug Induced Deaths in the Great Lakes Region

In 2019 there were over 74,500 drug induced deaths in the United States, or about 22.7 drug induced deaths per 100,000 population.  Almost 95% of these fatalities were attributable to drug overdoses, both intentional and accidental.  In the twenty years from 1999 to 2019, the number of drug induced deaths nationally jumped by over 50,000 per year and the death rate per 100,000 population more than tripled. While all regions of the country experienced sharp increases in the number of drug induced deaths in the twenty years from 1999 to 2019, the experience in the five-state Great Lakes region was particularly bad.  From a drug induced death rate per 100,000 population that was almost 16% below the national average in 1999, by 2019 the region's drug induced death rate was over 20% above the national average rate.  A review of data from the Centers for Disease Control and Prevention, National Center for Health Statistics, reveals the following about drug induced deaths in the Great Lakes region.:

Drug Induced Deaths in the Great Lakes Region

Drug Induced Deaths in the Great Lakes Region

State/Deaths 1999 2009 2019
IL 872 1,427 2,846
IN 251 929 1,756
MI 708 1,750 2,565
OH 534 1,340 4,440
WI 237 641 1,226
Region 2,602 6,087 12,833
U.S. 19,128 39,147 74,511
State/Death Rate* 1999 2009 2019
IL 7.1 11.2 22.5
IN 4.2 14.4 26.1
MI 7.2 17.7 25.7
OH 4.7 11.6 38.0
WI 4.4 11.3 21.1
Region 5.8 13.1 27.4
U.S. 6.9 12.8 22.7

(*) number of drug induced deaths per 100,000 population

Source: CDC Wonder. Centers for Disease Control and Prevention, National Center for Health Statistics. Underlying Cause of Death 1999-2019 on CDC WONDER Online Database, released in 2020. Data are from the Multiple Cause of Death Files, 1999-2019, as compiled from data provided by the 57 vital statistics jurisdictions through the Vital Statistics Cooperative Program. Accessed on June 5, 2021

Sunday, June 6, 2021

Massage Therapist Pay in the Southwest

Recently released U.S. Bureau of Labor Statistics (BLS) data indicates that, as of May 2020, there were more than 85,000 massage therapists employed in the United States.  Over 8,000 of those massage therapy jobs were in the four-state Southwest region of the country.  An examination of BLS data reveals the Southwest to be a modestly poor one for massage therapist pay, with New Mexico being the only state in the region with massage therapist annual mean wages above the national average.  A closer look at BLS data from May 2020 shows us the following about massage therapist pay in the Southwest:

Massage Therapist Pay in the Southwest

Massage Therapist Pay in the Southwest


State # Employed Annual Mean Wages Wage Rank*
AZ 2,910 $46,310 23rd
NM 450 $52,250 11th
OK 310 $39,910 41st
TX 4,440 $42,350 36th
U.S. 85,040 $47,350 -------

(*) annual mean wage ranking among the 50 states and the District of Columbia

Source: U.S. Bureau of Labor Statistics OES. Data extracted on June 5, 2021

Friday, June 4, 2021

Speech Language Pathologist Pay in the Far West

U.S. Bureau of Labor Statistics (BLS) newly published reports indicate that there were nearly 148,500 speech language pathologists (SLPs) employed in the United States as of May 2020.  More than 20,000 of those employed as SLPs in the U.S. lived in the six-state Far West region of the country.  The Far West region is a relatively good one for speech language pathologist pay, with three states (Alaska, California, and Oregon) in the region registering SLP annual mean wages in the top 10 nationally. On the other hand, other states in the region fall below the national average for SLP pay.  A closer look at BLS data from May 2020 reveals the following about speech language pathologist pay in the Far West region:

Speech Language Pathologist Pay in the Far West

Speech Language Pathologist Pay in the Far West

State # Employed Annual Mean Wages Wage Rank*
AK 260 $87,250 10th
CA 14,640 $95,570 5th
HI 310 $82,750 15th
NV 930 $78,880 27th
OR 1,700 $87,850 8th
WA 2,930 $80,730 21st
U.S. 148,450 $83,240 -------

(*) annual mean wage ranking among the 50 states and the District of Columbia

Source: U.S. Bureau of Labor Statistics OES. Data extracted on June 2, 2021